I want to do volume rendering (representation “Volume”) with ParaViewCatalyst. At first, I built ParaViewSuperbuild on the server, installed ParaViewCatalyst on the server, and connected to the client PC using Examples / Catalyst included in ParaViewSuperbuild, and I was able to in-situ visualize the Slice Surface of the volume data. Next, I tried to create a Catalyst Script for Volume Rendering according to the User’s Guide. However, there is no “CatalystScriptGeneratorPlugin” item in the “Manage Plugins” menu in my ParaView. So I tried to rewrite the Slice Surface script for Volume Rendering but it failed. Could you provide a Python script for volume rendering? Targeting volume data is consists of the unstructured hexahedral mesh, and some vertex defined scalar data (density, temperature, pressure).
Can you specify your ParaView version ?
The CatalystScriptGeneratorPlugin was deprecated in 5.6 and removed later, as the GUI feature was refactored and integrated in the core of PV.
Thank you for your response.
I used ParaView 5.7.
I also tried 5.8 superbuild, but failed to compile on server.
Should I switch to ParaView 5.6 to perform VolumeRendering on Catalyst?
I would be grateful if there was a way to realize it with ParaView 5.7.
Sincerely,
Takuma Kawamura
No need to switch back : the plugin disappeared but the features still exists.
What are you trying to do when you say ‘Volume Rendering’ ? Is it live visualization or screenshots export ? Both are definitly possible in 5.7
Thanks your response.
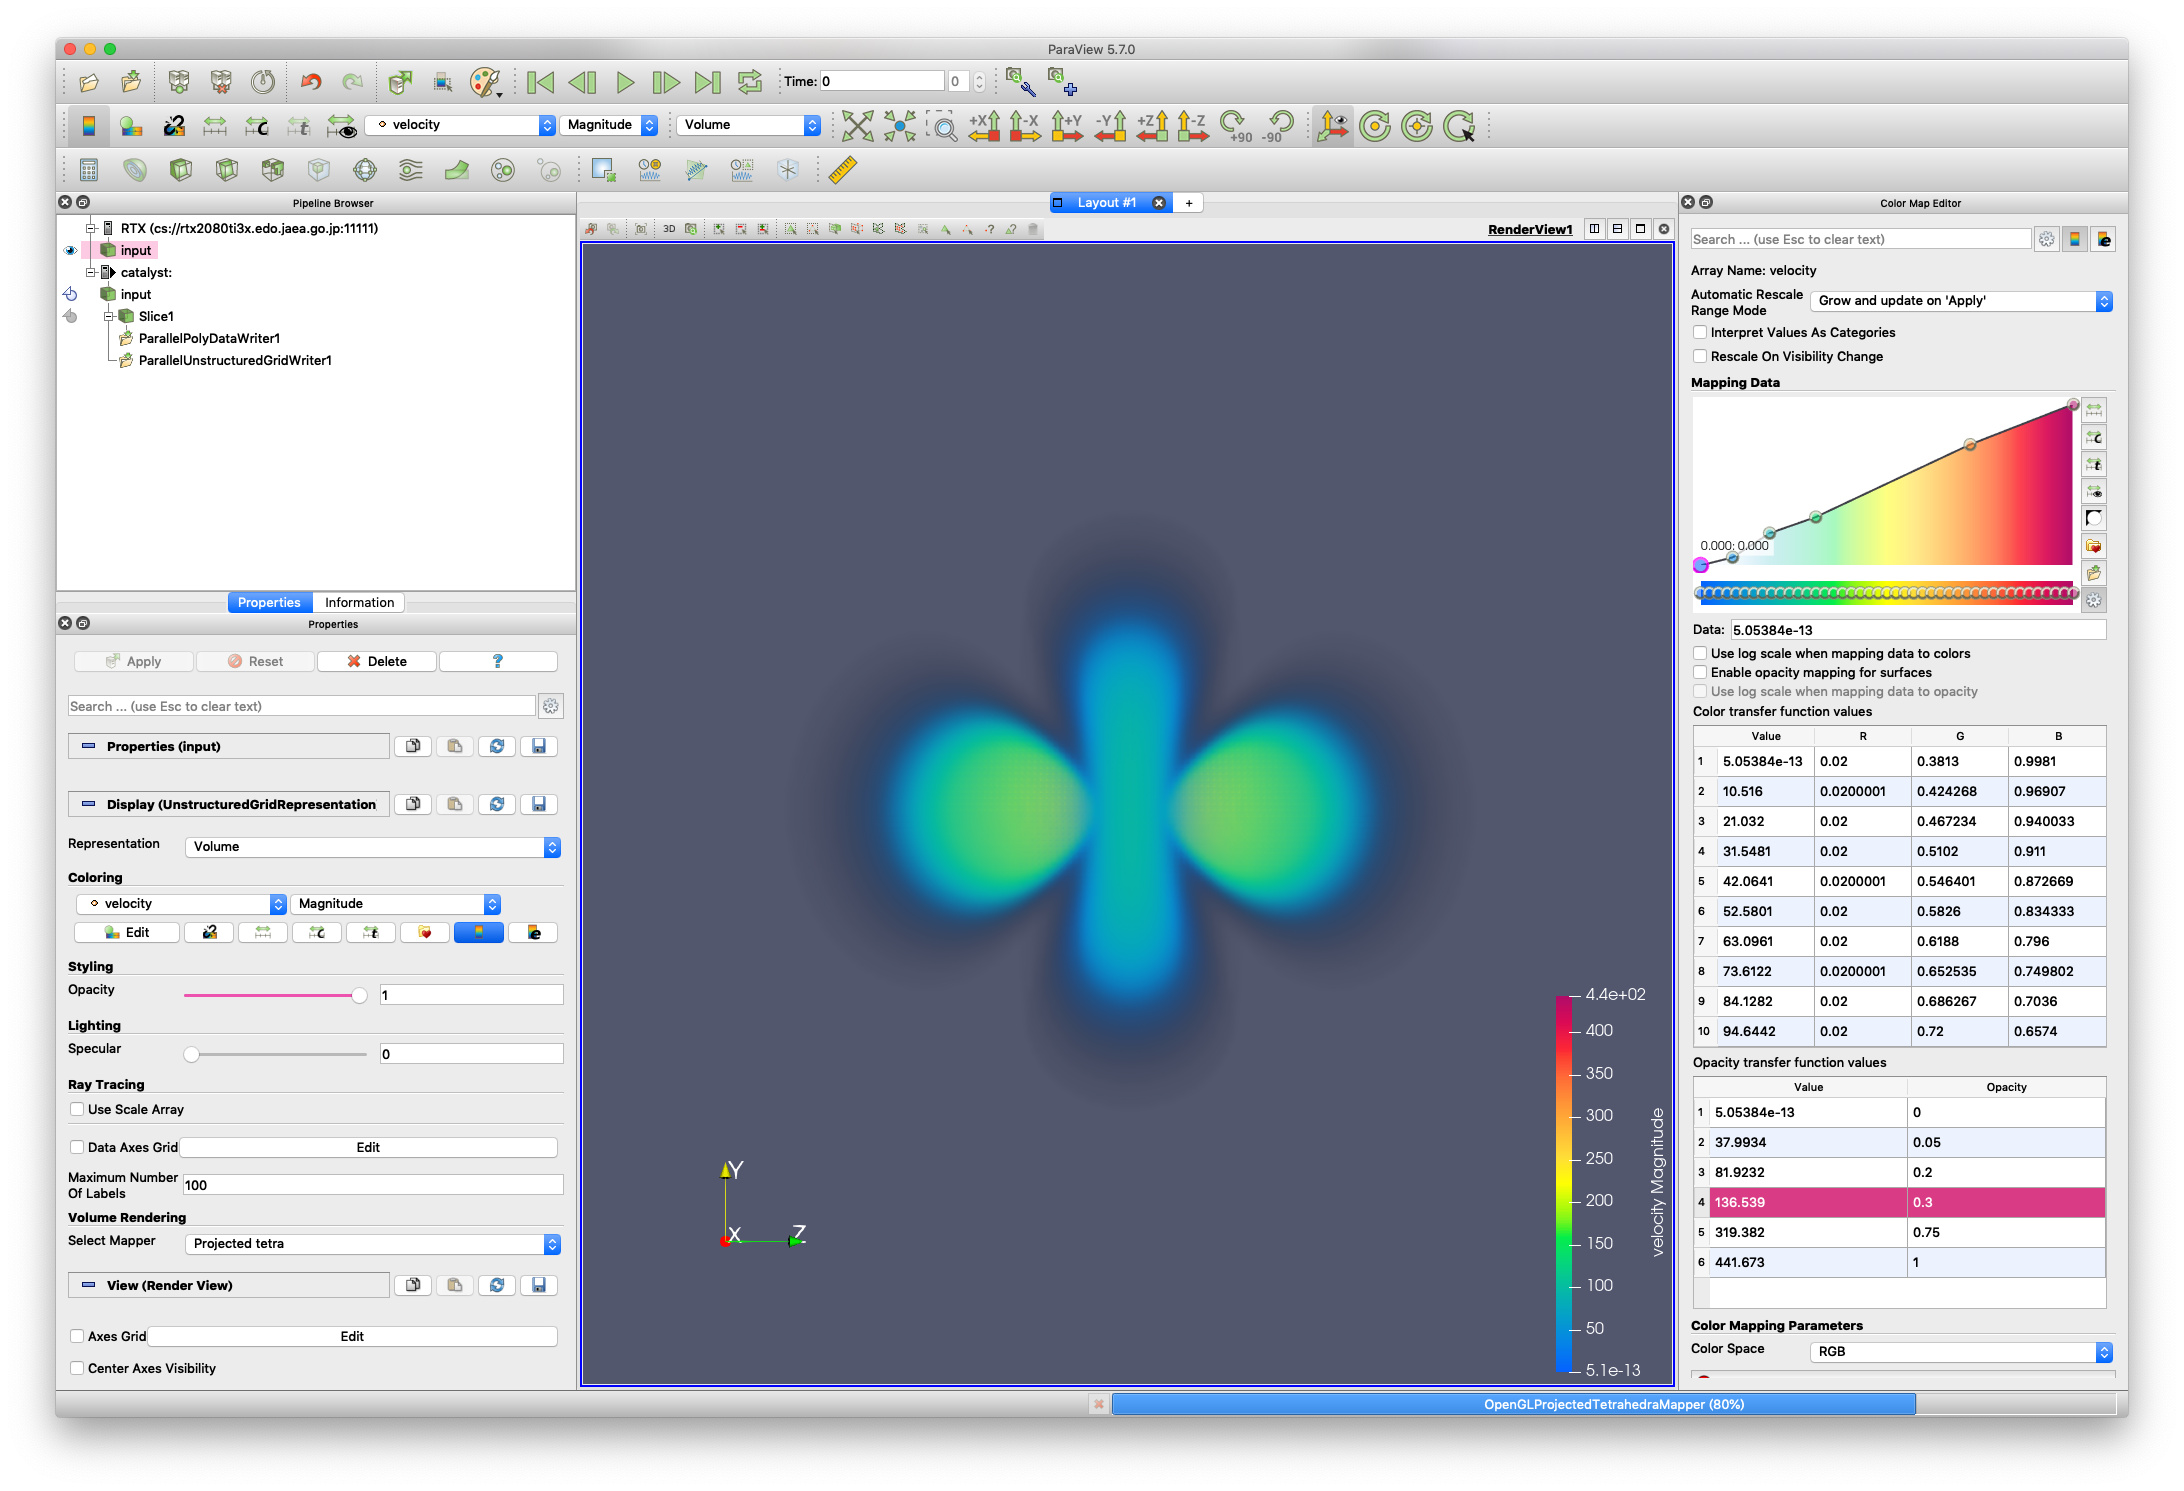
I mean “Volume Rendering” as representation -> volume.
Its method is projected tetrahedra or ray-tracing.
I’d like to try both of live visualization and off-screen rendering.
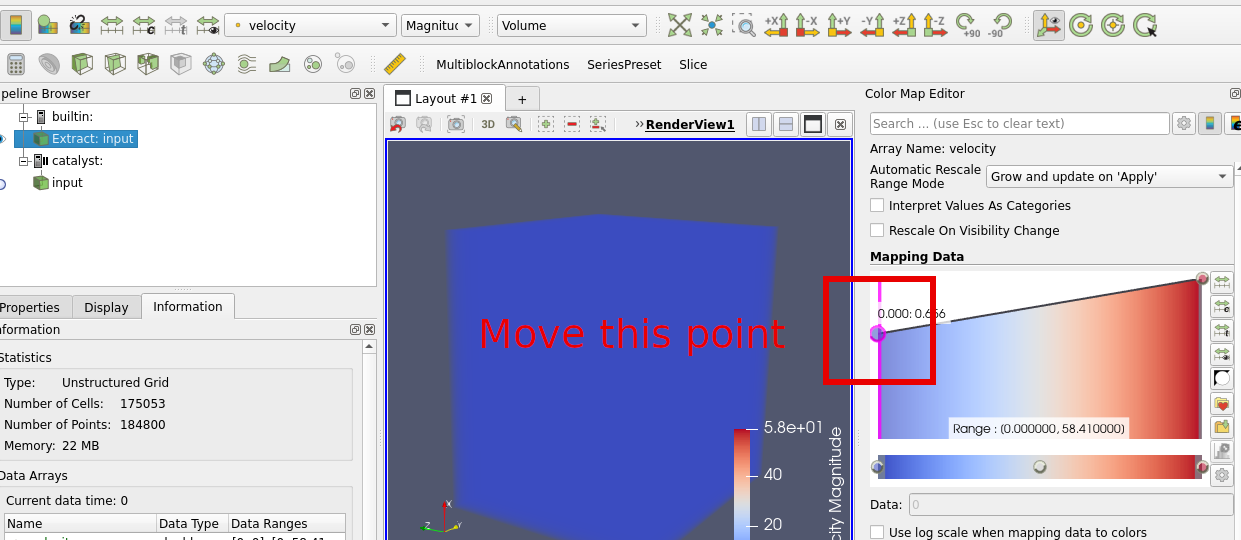
If you are in live visualization, set the representation to Volume as usually in the GUI
If you want screenshots configure your script:
- open a representative data in ParaView
- set representation to Volume
- use the Export Inspector to configure screenshots
- export the script
I tried Catalyst Example “CFullExample” as the live visualization, and set the representation from Surface to Volume in Paraview GUI.
But It didn’t work. Nothing is rendered.
CFullExample’s python script specifies “Slice1 = Slice( guiName=“Slice1”, ……… )”, so I thought the script has to modified for Volume representation.
Thank you