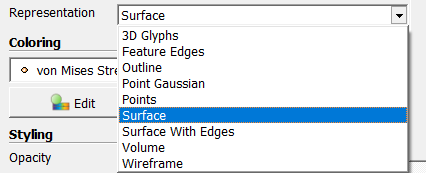
I’m a new user of ParaView. I know the basics but I can’t figure out if there’s a way to use volume representation for FEA results obtained with CalculiX solver. Specifically, I have some test results from FreeCAD FEM module which utilizes CalculiX as its main solver. Some of the ParaView functions are built into this module as well. However, to obtain a classic contour plot of the results (with legend) one has to use the pipeline feature which allows only for surface representation and the legend itself includes results only from the surface (while in some cases max/min values might occur inside the model). I thought that exporting the results in vtk format to ParaView might help as this software offers many more functionalities. But it seems that the same issue is present here as well - I can do some view cuts with filters but it’s still a surface representation with legend. Available types of representations don’t include anything like a volume plot:
Is there a way to bypass this limitation ? Or am I wrong about the way those ParaView contour plots work ?
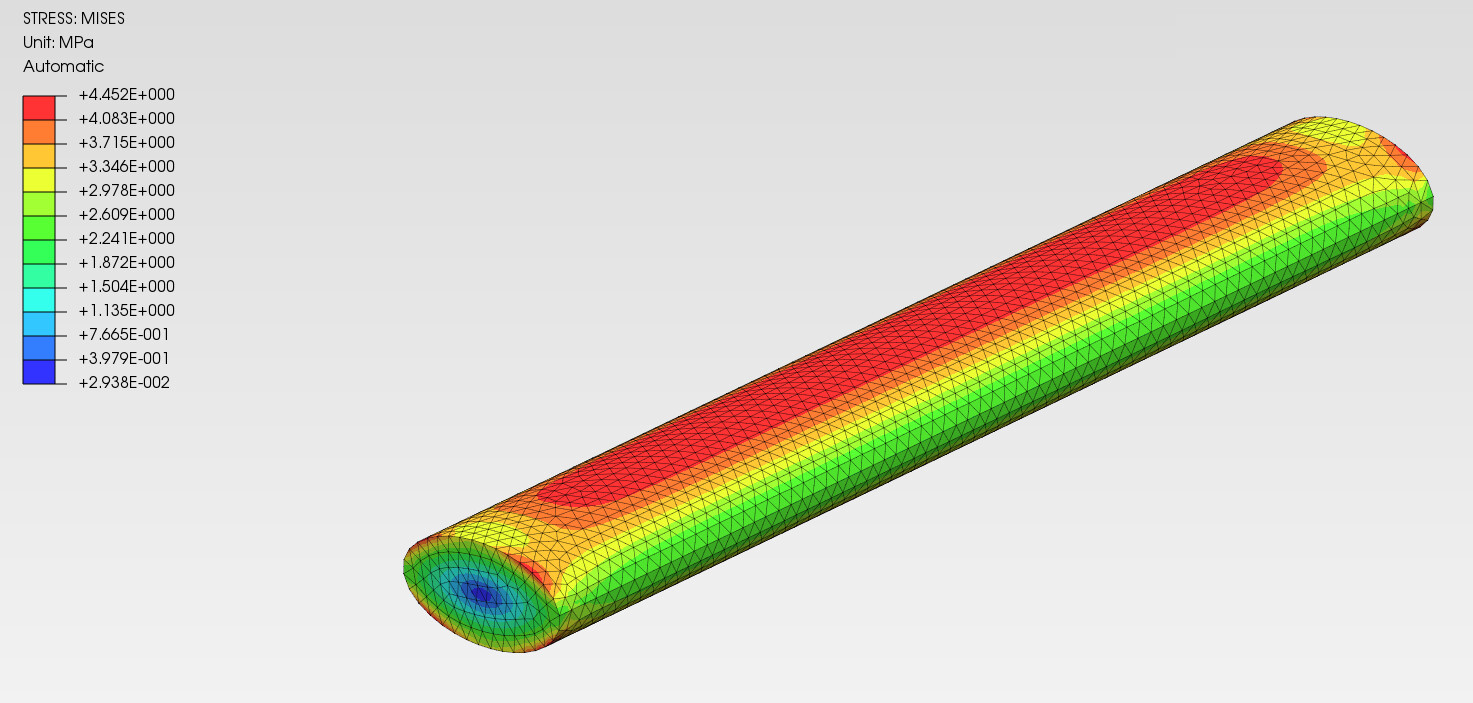
I forgot to comment on that. The volume representation listed here is something different than what I want to achieve. I would like to generate a contour plot that looks like a surface one (since we can see only the surface unless we do the cut) but its legend accounts for values inside the model. That’s how a typical postprocessing is done in pretty much all FEA software.
It looks like a surface representation but the legend accounts for values inside the model. And if you were to hide some mesh elements from the display, you would see the colors inside.
I’m actually confused how this request is different from the normal surface representation. If you have a volume, choose the surface representation, and then color it by a field value, the legend will be scaled, by default, to the values throughout the mesh.
@Kenneth_Moreland I was told that this is how a pipeline plot implemented in the FreeCAD FEM module (the only way to obtain contour plots with legend in that software) works. But maybe it’s not the case or ParaView has different surface representations with legends accounting for internal values. Then it would be enough for me to export vtk results after simulations.
Anyway, is it possible to hide a few selected elements from the display in ParaView (to look inside the model) ? This would probably require some tricks as surface representation won’t work.
If you don’t want the color legend to included values inside the volume in the color legend range computation, you could run the Extract Surface filter first to extract out only the out surface elements and associated data.