Hello, everyone!
I have a vti file where 2D vorticity data in. 2_9683.vti (770.3 KB)
When I try to plot the vorticity contour using contour, I was not able to select vorticity data.
contour
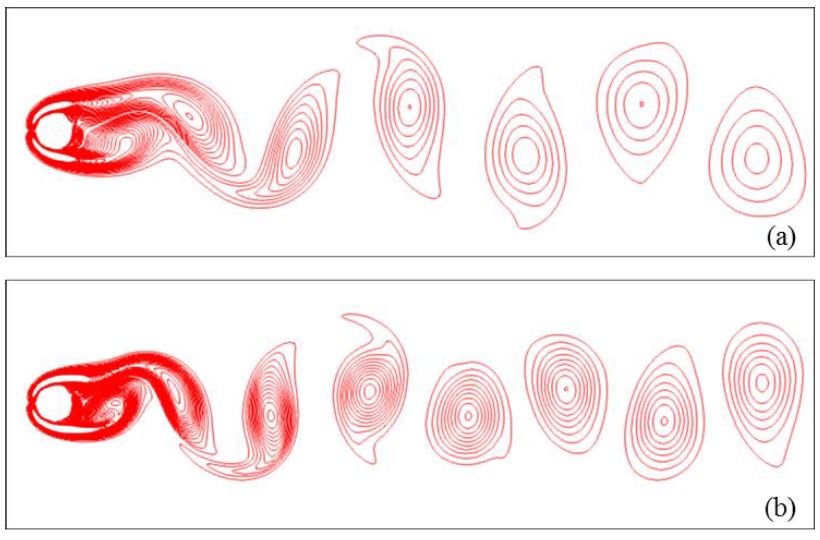
How do I plot the contours like this way?
Thank you in advance! Best regards, Sopo
The Vorticity in your data is cell data. Contour can only run on point data. Use the Cell Data to Point Data filter to convert the vorticity to point data, and then the contour will work.
Vorticity
Contour
Cell Data to Point Data
Dear Kenneth,
Thank you for getting back to me!
I can plot the contour thanks to you.