I am completely new to this so please feel free to refer me to an existing response/post. I have, however, searched the forum and not found what I am looking to do…
I am importing data from a CSV in a X-Y-Z-Sig1-Sig3-Strain-Etc… format but the grid is not regular (tighter points in the center and more spaced away from center). I am looking to produce a VTK with “structured points” (binary or ascii) – this is required for another software (Voxler).
a) Is this VTK (the one I am trying to output) referred to as a 3D uniform lattice?
b) How would I use Paraview to interpolate between my unregular grid to produce the structured points VTK?
c) How can I export the result from Paraview to VTK?
d) Could I use Python to execute these operations in batch (read CSV, interpolate, and export to VTK)?
a) Is this VTK (the one I am trying to output) referred to as a 3D uniform lattice?
First, some semantics:
VTK is the Visualization ToolKit, a visualization library.
vtk file or .vtk is a (legacy) file format used by VTK to store data on disk, like csv, it can store most of the type of datasets VTK can handle, including 3D uniform lattice.
VTK support many different type of datasets, the one you are looking for is vtkUniformGrid, I believe.
A more modern approach is to store 3D unifrom lattice in .vti file, not .vtk
b) How would I use Paraview to interpolate between my unregular grid to produce the structured points VTK?
c) How can I export the result from Paraview to VTK?
Here is how to “convert” a unregular set of points in a .csv into a regular grid stored in a .vtk file (or .vti) :
Open you .csv with ParaView, make sure to confiugre it correctly, Apply
Add a TableToPoints filter, configure the X, Y, Z correctly, Apply
Add a RessempleToImage filter, Apply
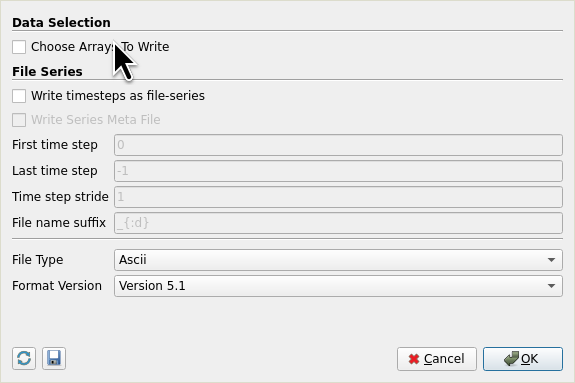
File → SaveData into a .vtk (or .vti) file
d) Could I use Python to execute these operations in batch (read CSV, interpolate, and export to VTK)?
Yes, using pvpython or pvbatch, but let’s get there once the GUI process is clear enough for you.
I realized that ParaView version 4.2 had to be to generate the .vtk file for my other software to be able to read/import. In v4.2, I used the “ImageResample” filter (seems quite identical to “ResampleToImage” of v5.8).
Two questions:
a) However, it only seems to interpolate at the boundary of limits. The “inside” of the face boundaries are empty (no points).
b) Also, when I try to sample on a 100 x 100 x 100 pattern, the computational time is very long (initial .csv has 100 000 points and 10 parameters).
hey mathieu,
i need to import a mesh to openfoam, and it can read .vtk files, but I am not able to export it in recent paraview versions, I am missing something?
saddly, .msh file is not compatible as paraview exports in 4.1 version which is not fully compatible with openfoam
EDIT: my bad, it was a multiblock, vtk format was not able there.
EDIT2: still need to export in ascii vtk, and it looks like the legacy is in binary.
regards
It is not that is not working, i was trying to export a vtk but the source was a multiblock and it looks like paraview does not allow to export multiblock in vtk format, anyway, right now my issue is that i WAS able to export in legacy vtk, but only in binary, and i need in ASCII as OpenFOAM does not support vtk binary format.