I calculated the.silo file about hdf5 through an open source library and successfully opened it using paraview5.11. But the result is completely different from a.vtk file. I know how to use.VTK files, but I know nothing about post-processing.silo files.
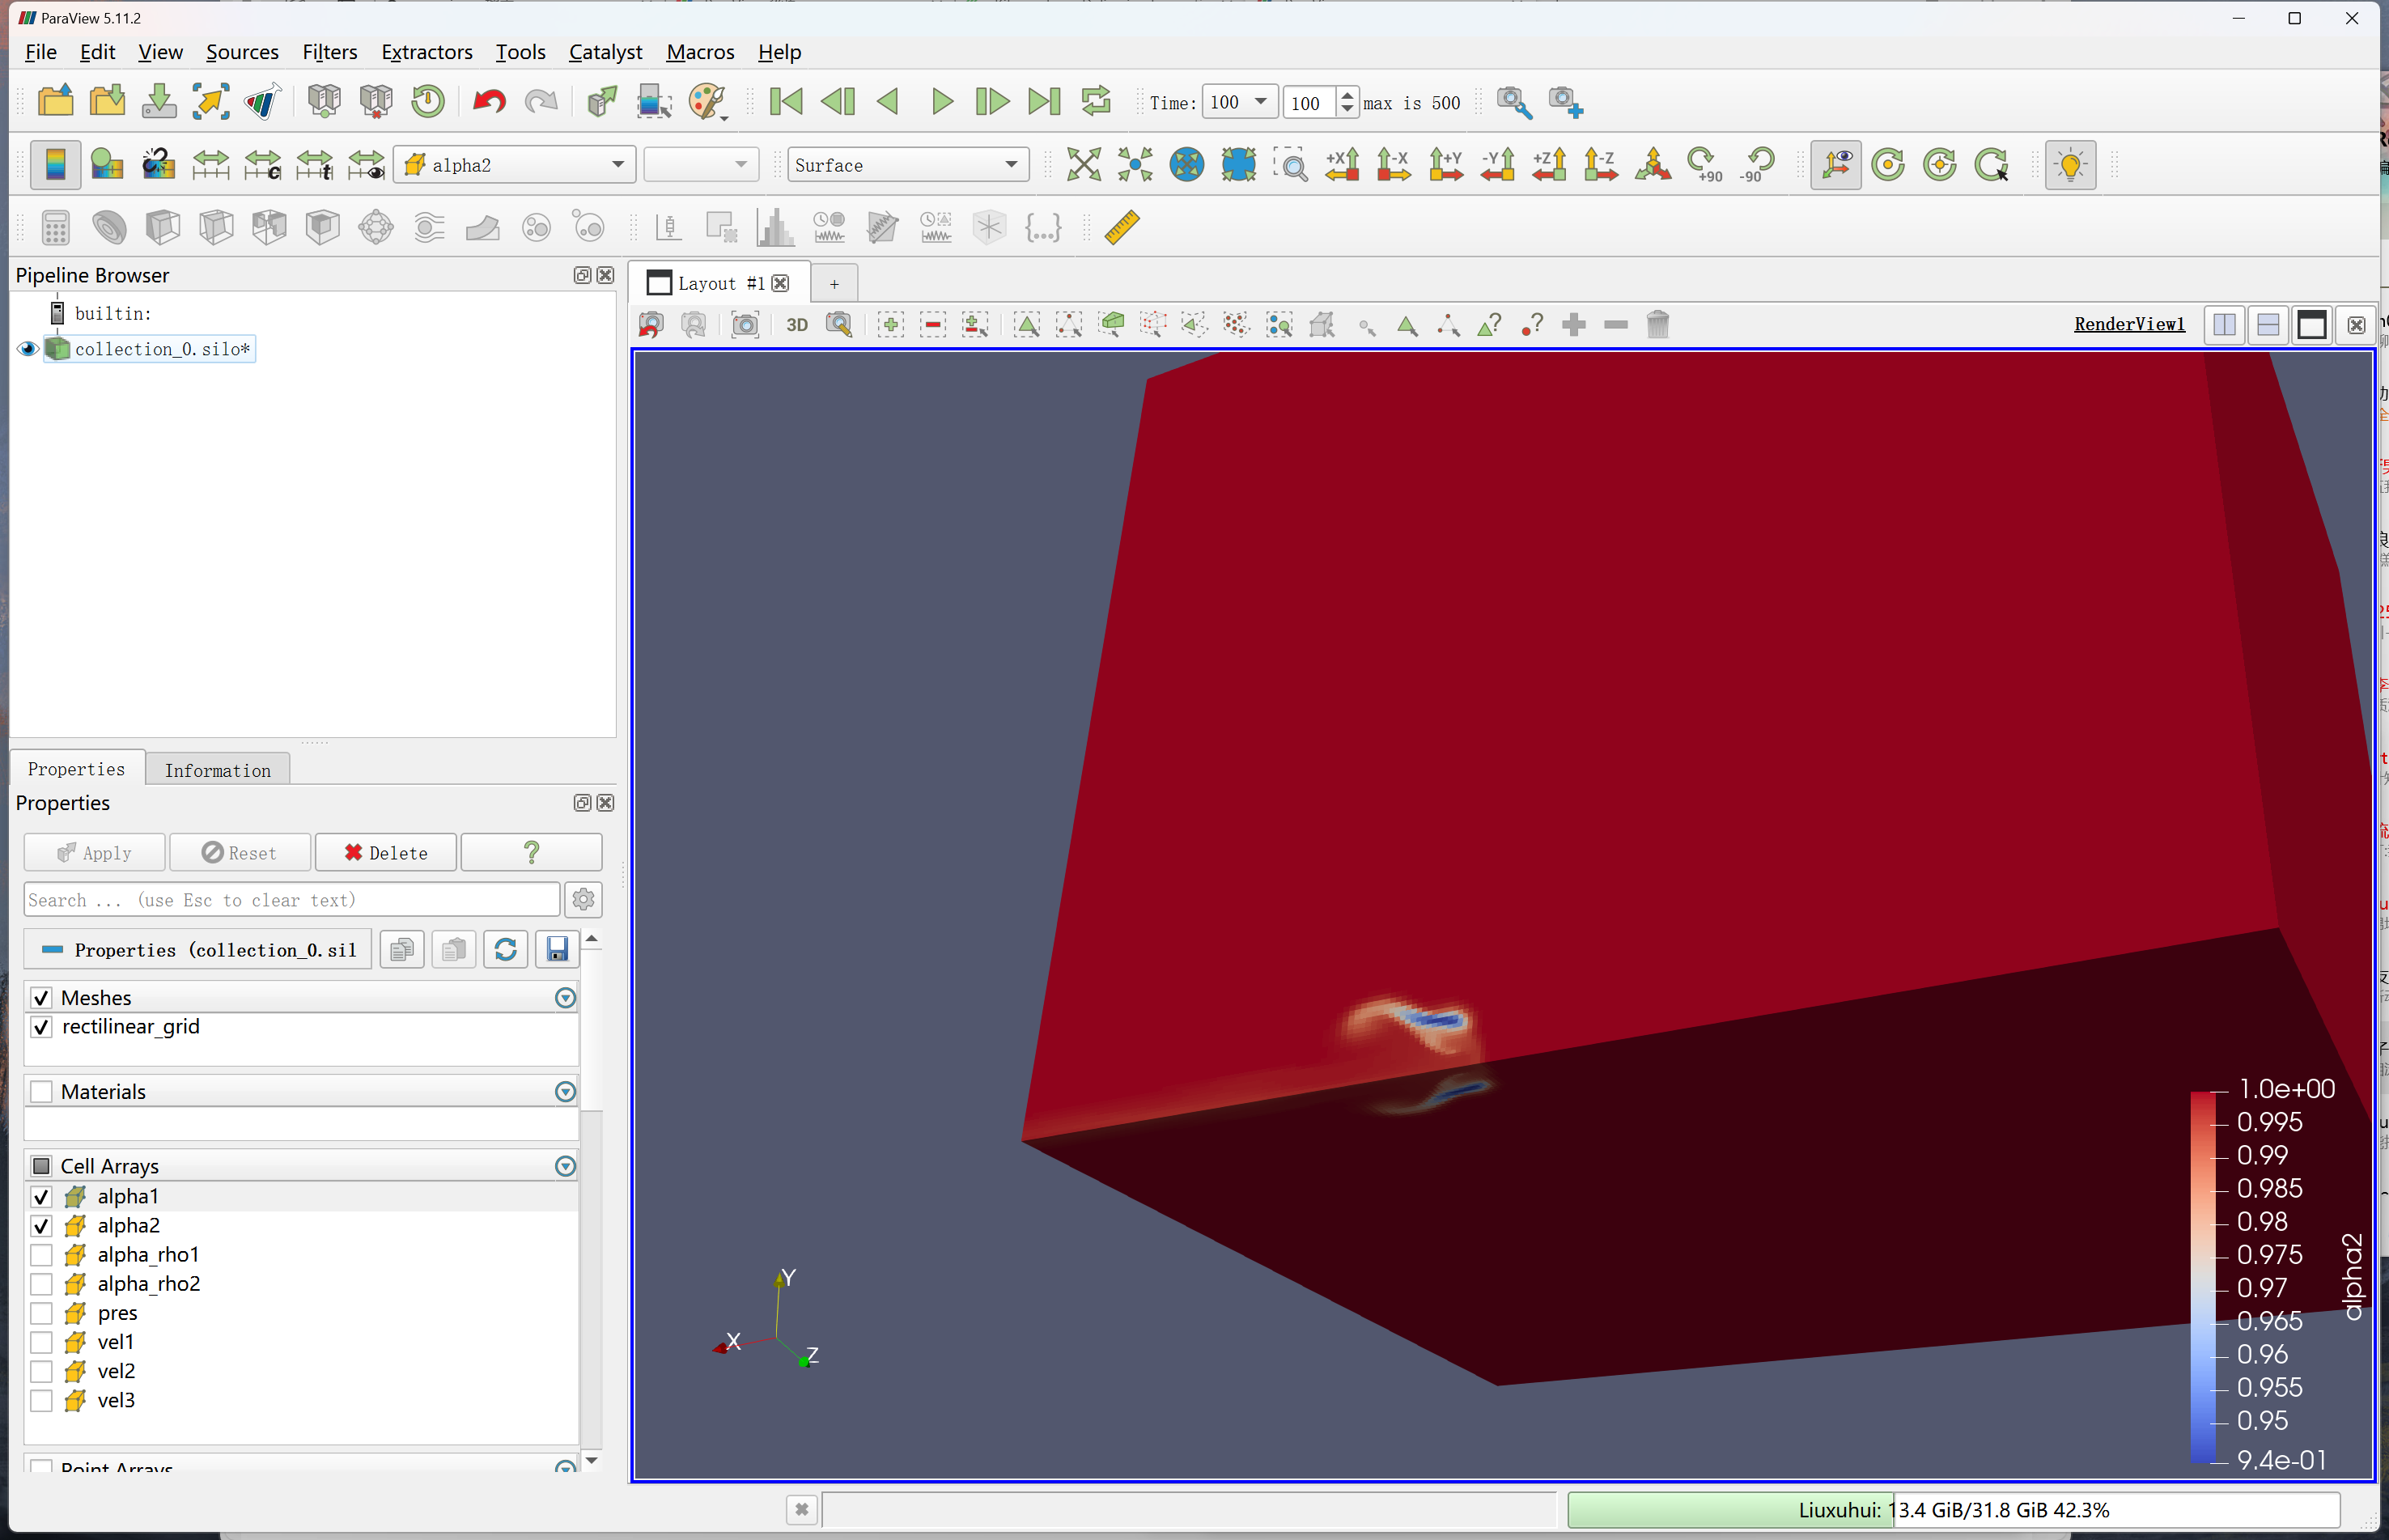
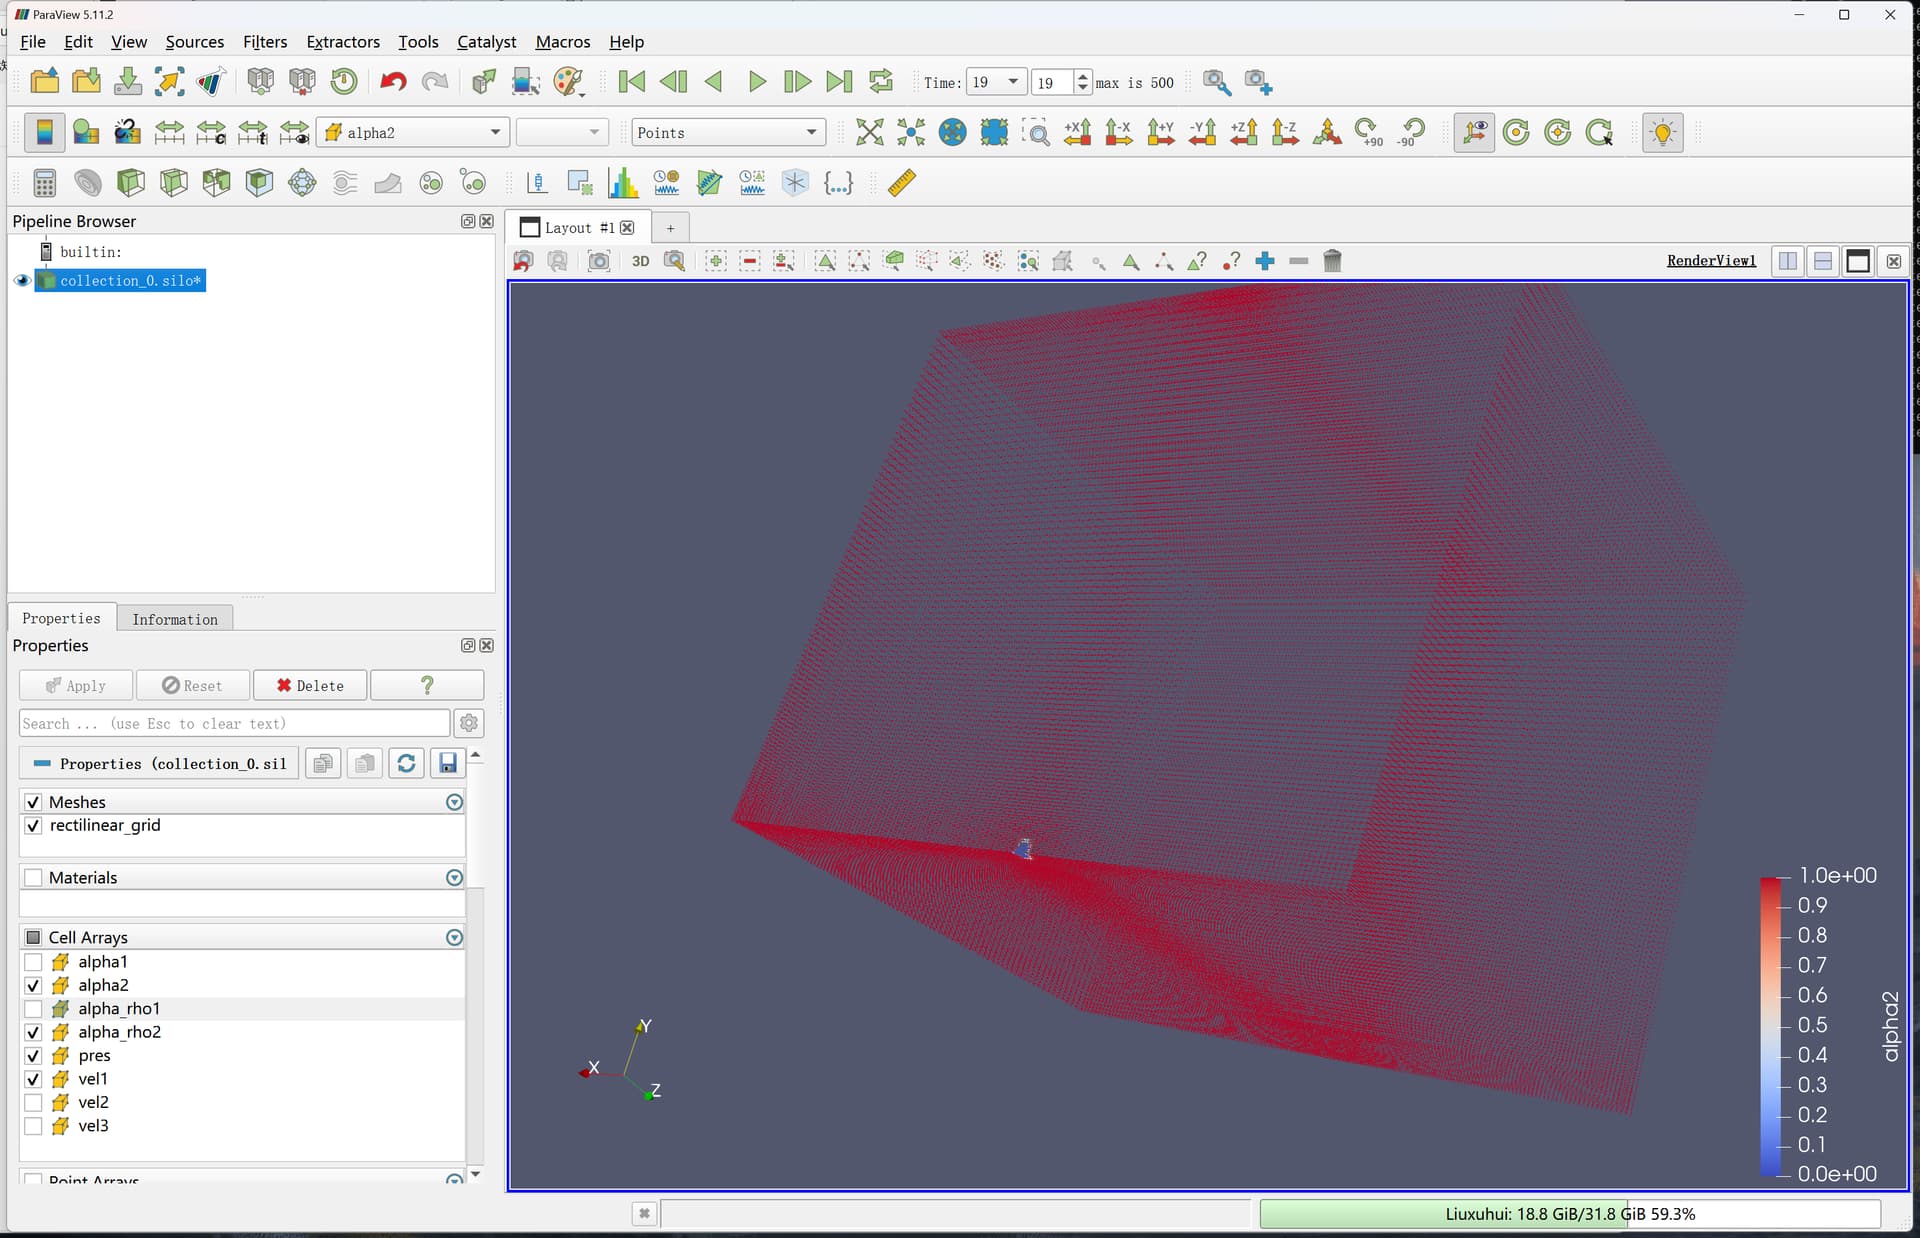
After I import the.silo file, I can only display the external grid and corresponding changes as shown in the figure. How can I post-process it to display 3D structure or flow field information?
Can someone teach me post-processing of.silo files or show me how to learn about them?
To visualize the different data, first be sure to load them (check desired Cell Arrays in the panel).
Then you can choose different Representation (instead of Surface). You can also check the data with a Spreadsheet View.
Yes, there are different variables in Cell Arrays, and I’m just showing one of them.
I tried different representations, not just the surface. The point shown in the figure is only the boundary of the cube.
Does it mean that my exported.silo file only contains the content of the boundary, but does not contain the 3D data (I calculated the 3D result)? (Because I found contour not available in the interface)
Yes, I have changed Representation. The volume cannot be displayed. Neither “clip”, “slice” or “threshold” can display the desired result (i.e., the three-dimensional structure of the flow field in the form of.VTK).
I don’t know how to manipulate it so that it doesn’t show the river basin but just the information about the droplets. I am wondering if it is possible that the.silo file is not correct due to the software I use?
please share a working example: a VTK file and a screenshot of what you expect.
A specific data can be stored under a huge variety of formats (without information loss), so file format is not necessary an issue here. The issue is more likely about configuring your visualization