I am looking for a simple example that shows how plot particles that I can color according to point data and clip. I created a VTP file. It loads properly. The coloring by point data works great too. I have to visualize the points using the point gaussian option. However, if I want to clip the science, paraview crashes or does not show the correct clip. I am not sure I am using the correct format and could not find an example online. I am confused if I should be using cell option, but paraview complains when I do not include it.
Just wanted to follow up. Even if there is an example VTP file out there that someone is willing to share, I can probably take it from there. To be specific I am looking for a particle file that you can clip. That’s it!
great thank you. I see what you did. Will this be an issue if I go to a large number of points, say 100,000? Do you think I can keep it as a single cell polyvertex?
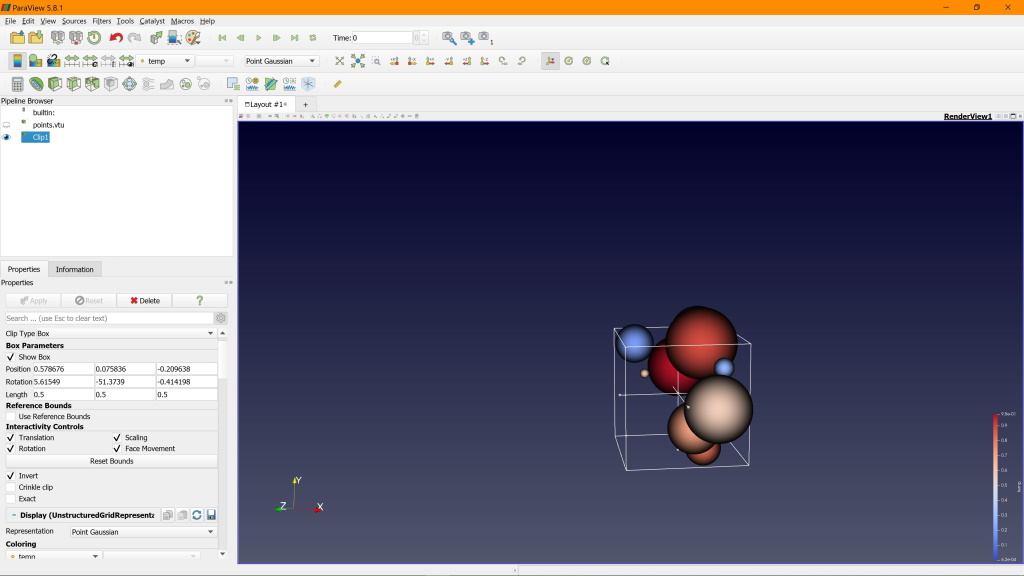
I had a similar issue when trying to clip away portions of a particle cloud that was rendered as “point gaussian”. I was expecting to cut pieces out from the rendered spheres, but the clip filter only removes the data points outside the clip region. So what you get is a smaller amount of the points, that you then can turn into “gaussian” rendered spheres again. See attached.
I would love to have clipping planes that apply to the rendering, but that seems specific to the render engine. The NVIDIA IndeX volume renderer supports this, for example.