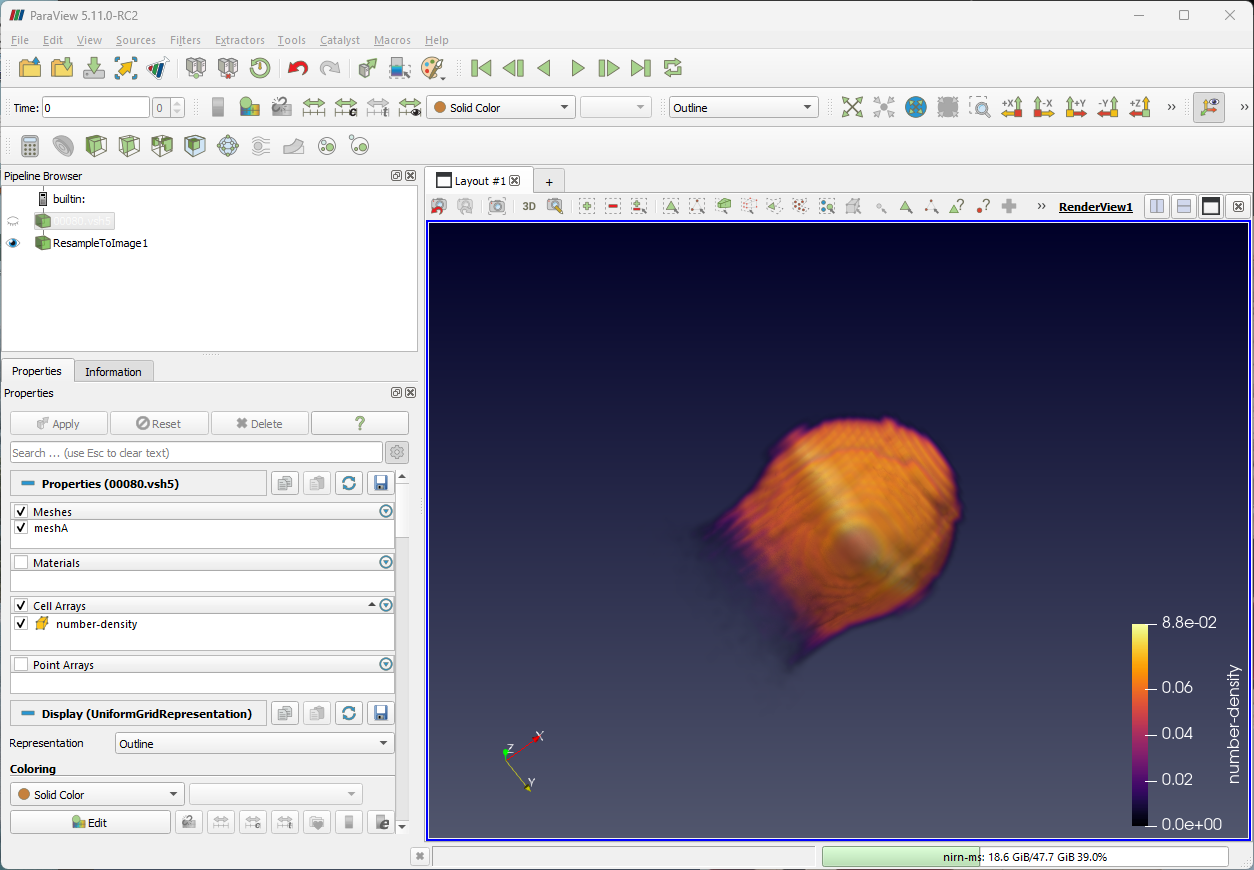
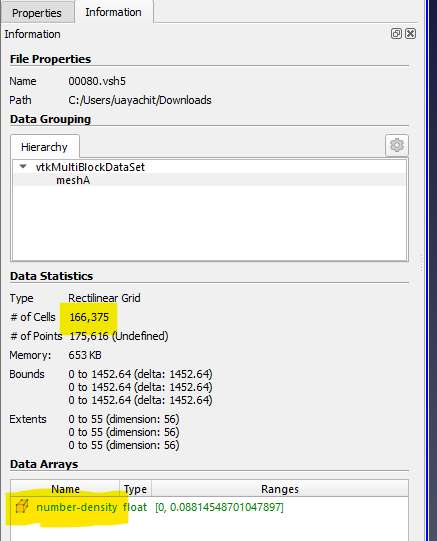
Hi. First of all, I’d like to thank all people behind ParaView. I have two questions about visualizing the 55x55x55 array stored in the HDF5 file attached (00080.vsh5):
-
It can’t be volume-rendered in ParaView (version 5.11) directly. I mean I just see a blank screen. I have to first apply a threshold filter removing all values below, say, 1E-10. Then it can be volume-rendered. Why? I don’t face this problem with VisIt.
-
Volume-rendering in VisIt can be done with a method named “Ray casting: compositing”, which has an option named “Kernel Based”. It produces good quality and quite smooth images, suitable for publication (see the image attached, produced from the same array). But I haven’t been able to obtain images of similar quality with ParaView so far. What are the best options for volume-rendering with high quality in ParaView?
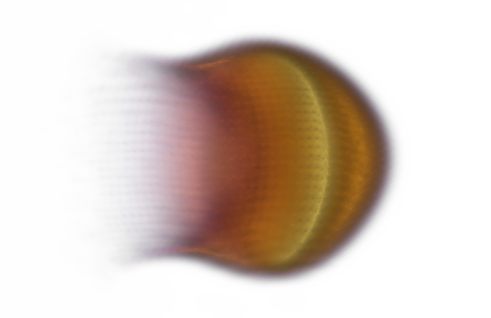
00080.vsh5 (652.6 KB)
Thanks
The deal is that ParaView errs on side of letting user transform the data. VisIt does some data transformations implicitly. In this case, the dataset is Multiblock of Rectilinear Grids. There’s some ongoing to make volume rendering of composite dataset work seamlessly. Until then, a manual resample to image does the trick. Note, in your case since the data is associated with cells. You can use CellDataToPointData to interpolate the data to make the volume appear similar to VisIt’s approach.
Here’s the same in ParaView.
with Cell To Point
without Cell To Point
Your answer was very helpful. But there is something that doesn’t seem to be right. The HDF5 file is produced by a program I’ve written. It includes VizSchema metadata describing the mesh. The mesh is supposed to be a single uniform rectilinear one, not a multiblock. Probably, the VizSchema reader of ParaView is not working properly.
Also the array size is 55x55x55. ParaView reports its size to be 56x56x56.
By the way, the file uses VizSchema 4 described at https://ice.txcorp.com:3000/projects/vizschema/wiki
The VizSchema reader in ParaView is based on a framework that simply brings in file-format readers from VisIt (which we call VisItBridge). This framework made some choices about how the data was going to be represented in ParaView and IIRC, all VisIt readers always bring in the data wrapped in a composite/multiblock dataset.
As far as the dimensions go, it needs a little digging into the data model details. The rectilinear grid reports point extents. You array is a cell-associated array. So the dimensions for grid are reported as 56x56x56, but if you look at the number of cells, which is same as the length of your data array, is indeed 55x55x55=166,375