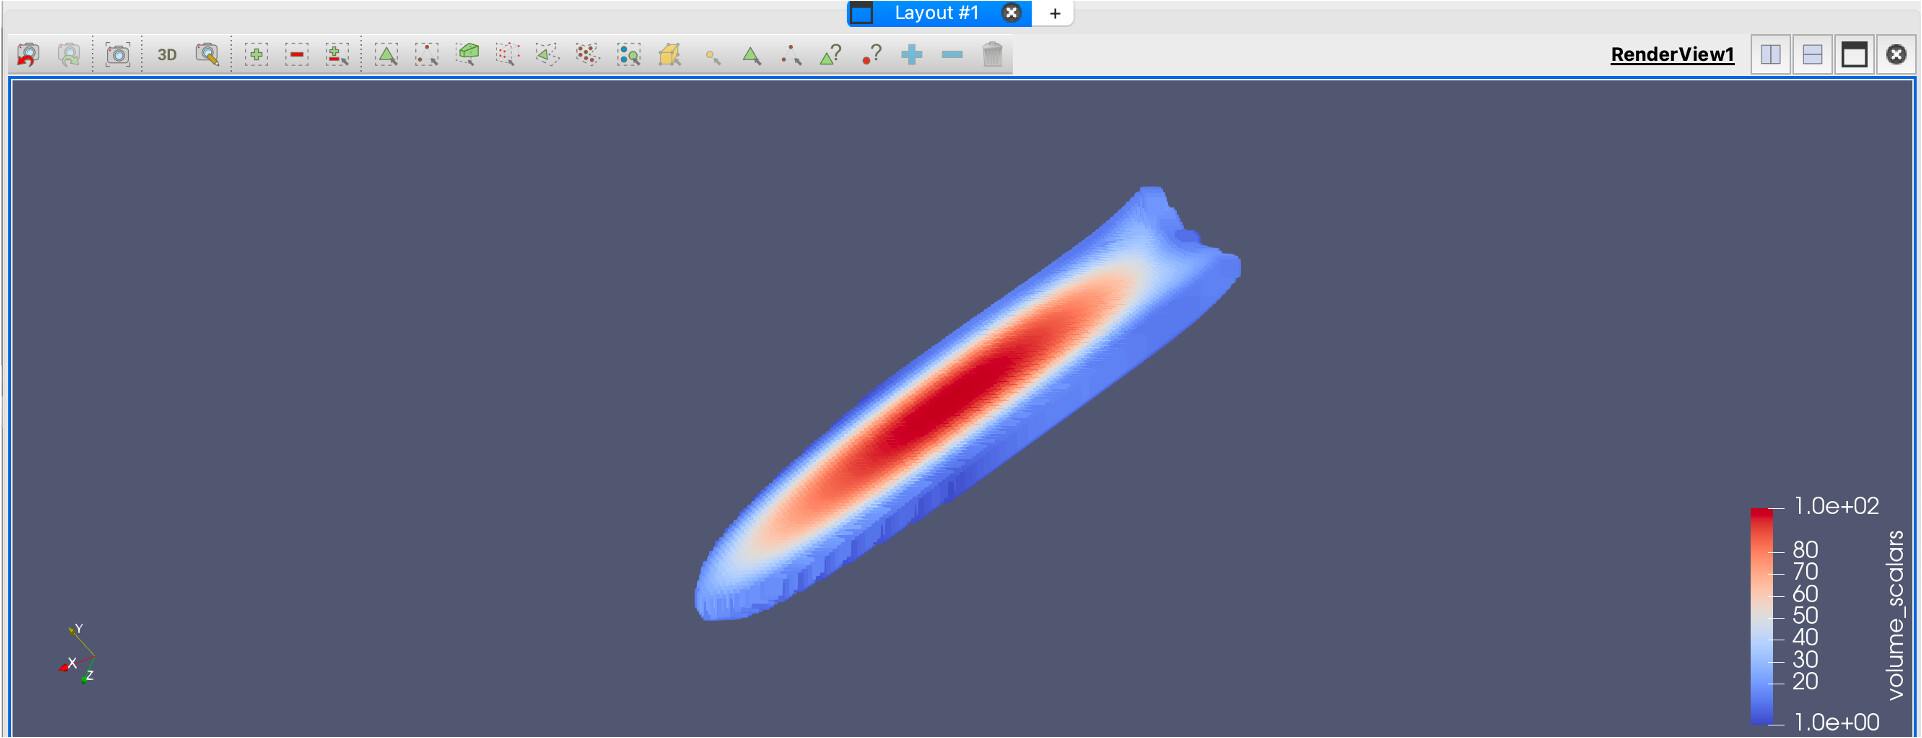
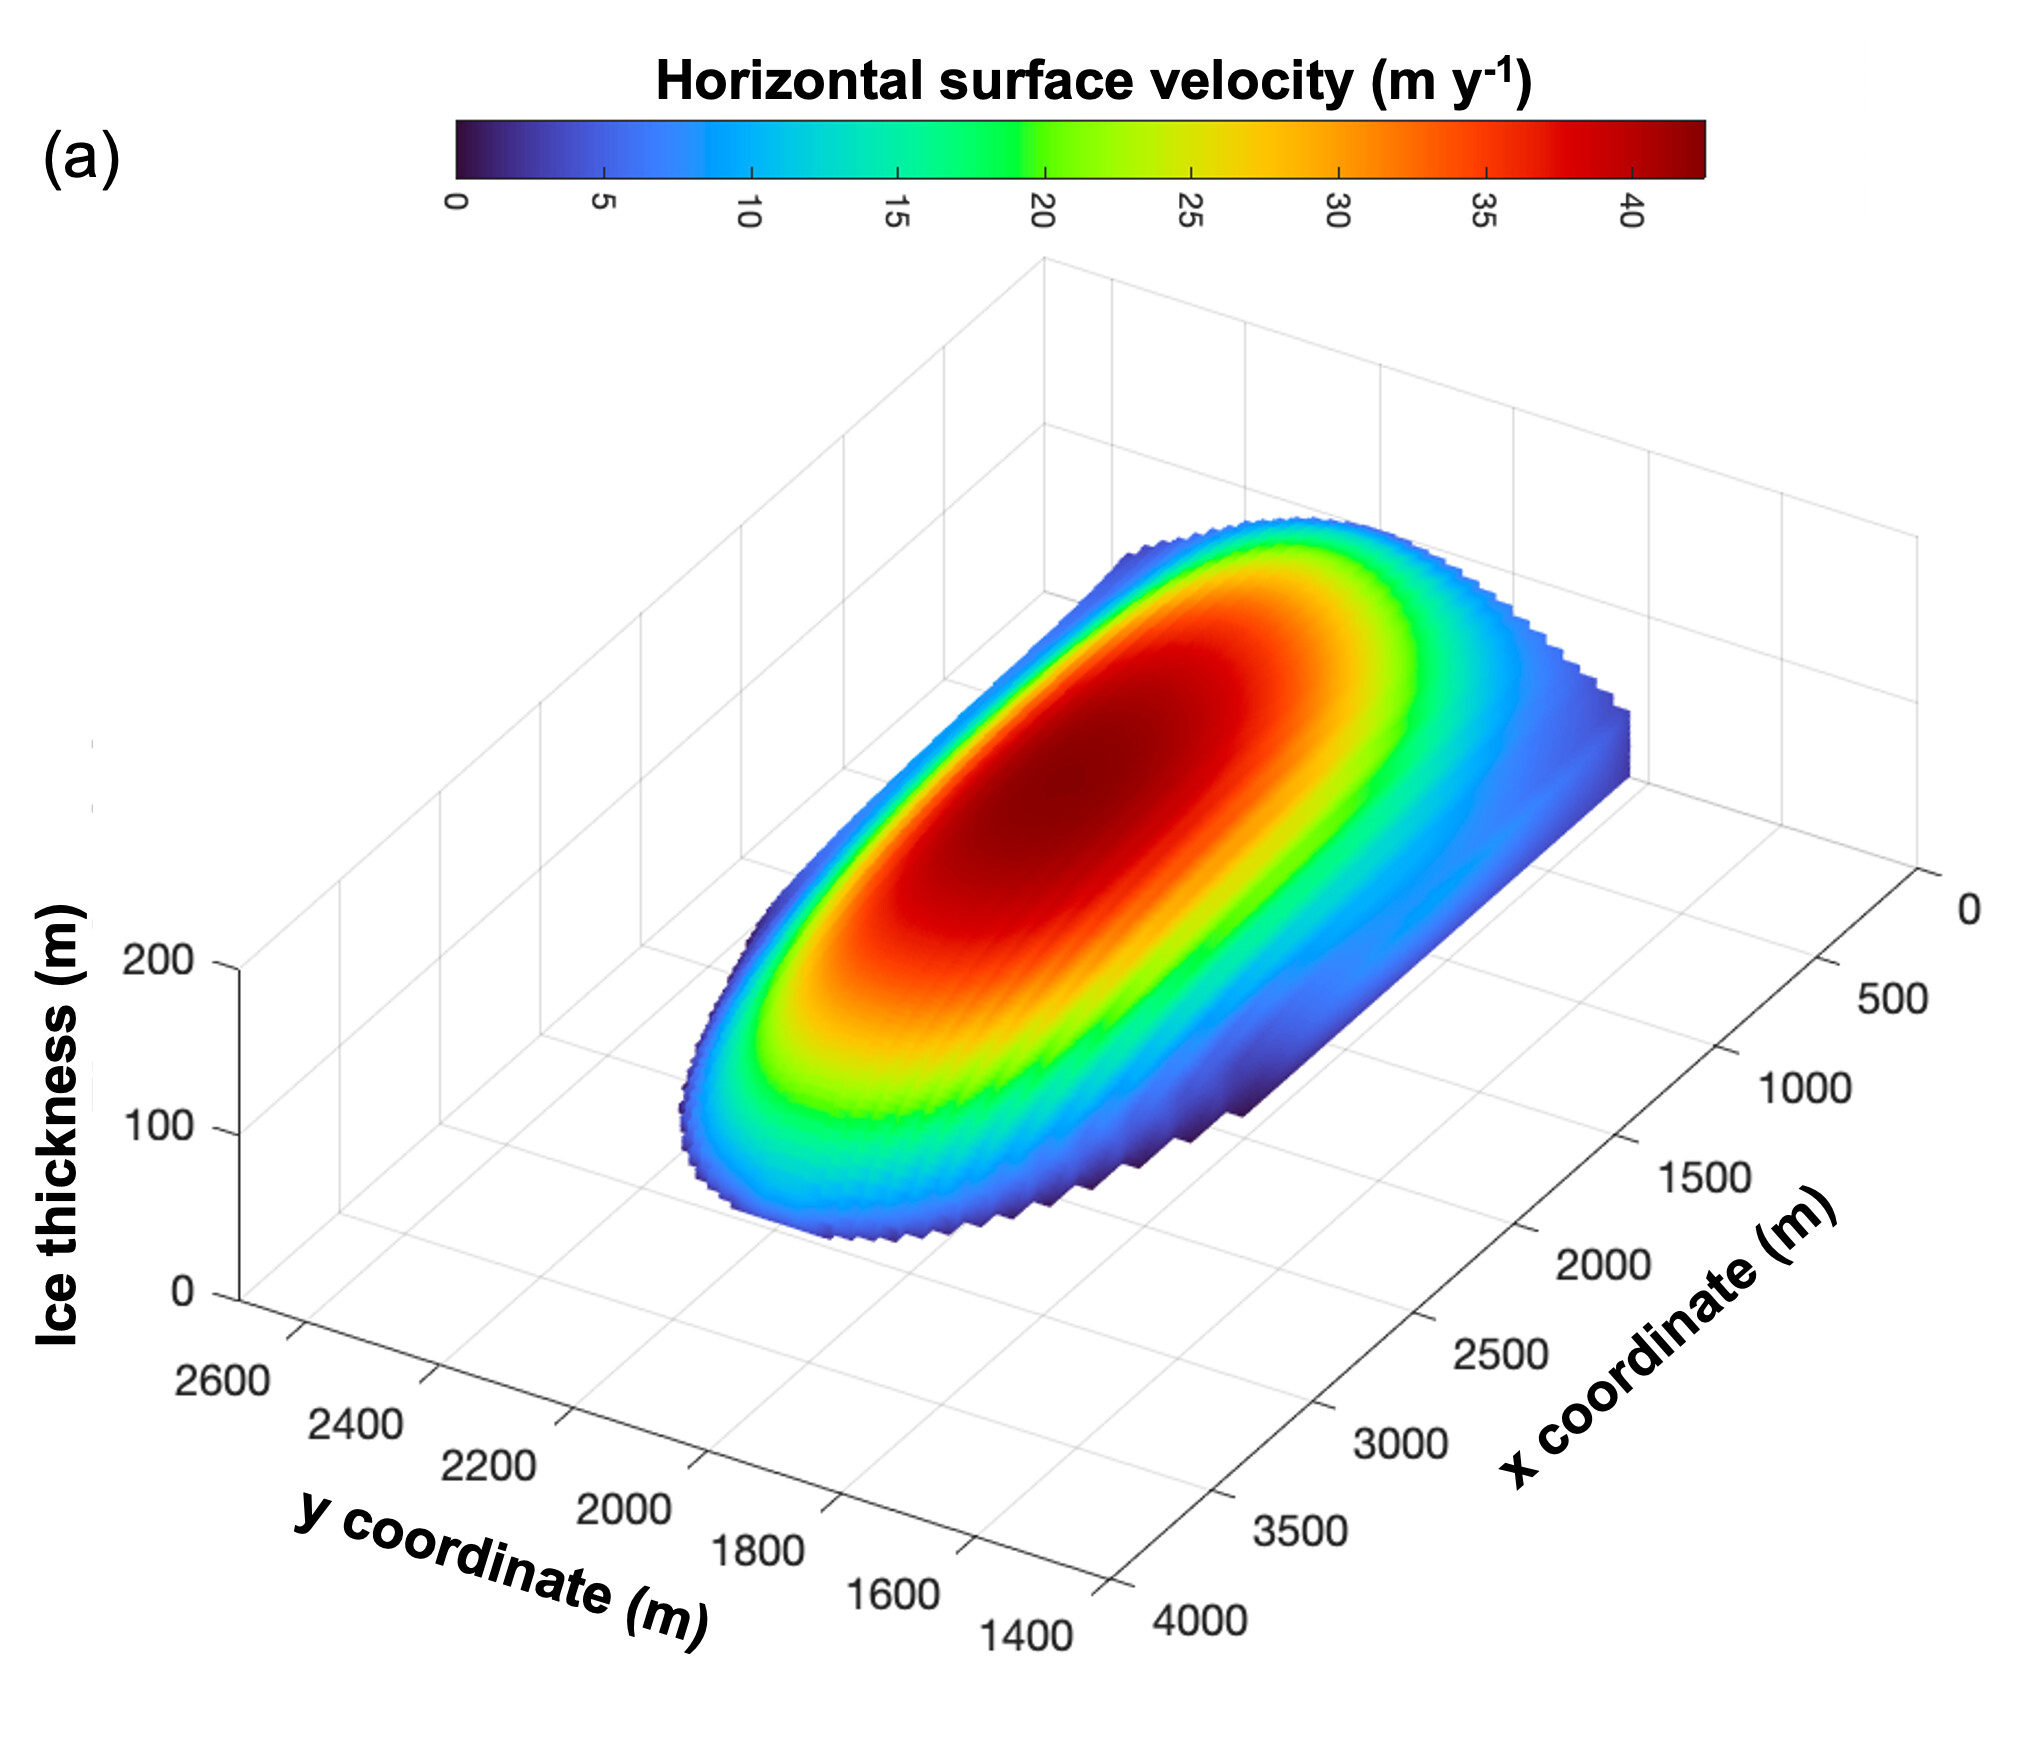
I have a 3D matrix of the surface field of a glacier that I want to plot using ParaView. The plotting itself is good (see attachment 1), but I have noticed that the range of the velocities changed. In ParaView, for one reason or another, the velocities are scaled between 0 and 100 m/y, but when I plot the same glacier with Matlab, the range is between 0 and 45 m/y (see attachment 2). If I adapt the colorbar in Paraview to these values, the magnitude of the ice velocities does not corresponding to their actual values (see attachment 3). Can anyone help me to get the correct visualization?
The data you posted is a big brick. It would help if you described how you extracted that shape out of the brick.
It looks like the volume_scalars field has a high gradient between the 0 and 100 values. Not knowing how you extracted this surface in ParaView and Matlab, my guess would be that there are very small differences in the interpolation that get exaggerated by the high gradient.
OK. After taking a look at your data, I expect the problem is that you are essentially cutting the data along an area of high gradient in a funny way and then showing the value of that same field where you sliced it. This is probably leading to uncertainty, and differences in how Matlab and ParaView are doing calculations are causing issues.
One thing I noticed is that it appears that the images you posted are showing opposite sides for Matlab and ParaView. Matlab is showing the convex side whereas ParaView is showing the flat side with a concave end. If you flip over the ParaView side, you will notice that ParaView is actually showing values less than Matlab, not more.
Other than that, I can’t really explain the difference. What ParaView is showing does not look wrong. Your Threshold operation is grabbing all cells where all the incident points are greater than 0.1. On the curved top, those cells seem to match that criteria. I cannot say why Matlab is shaving off what appears to be at least one more layer of cells.