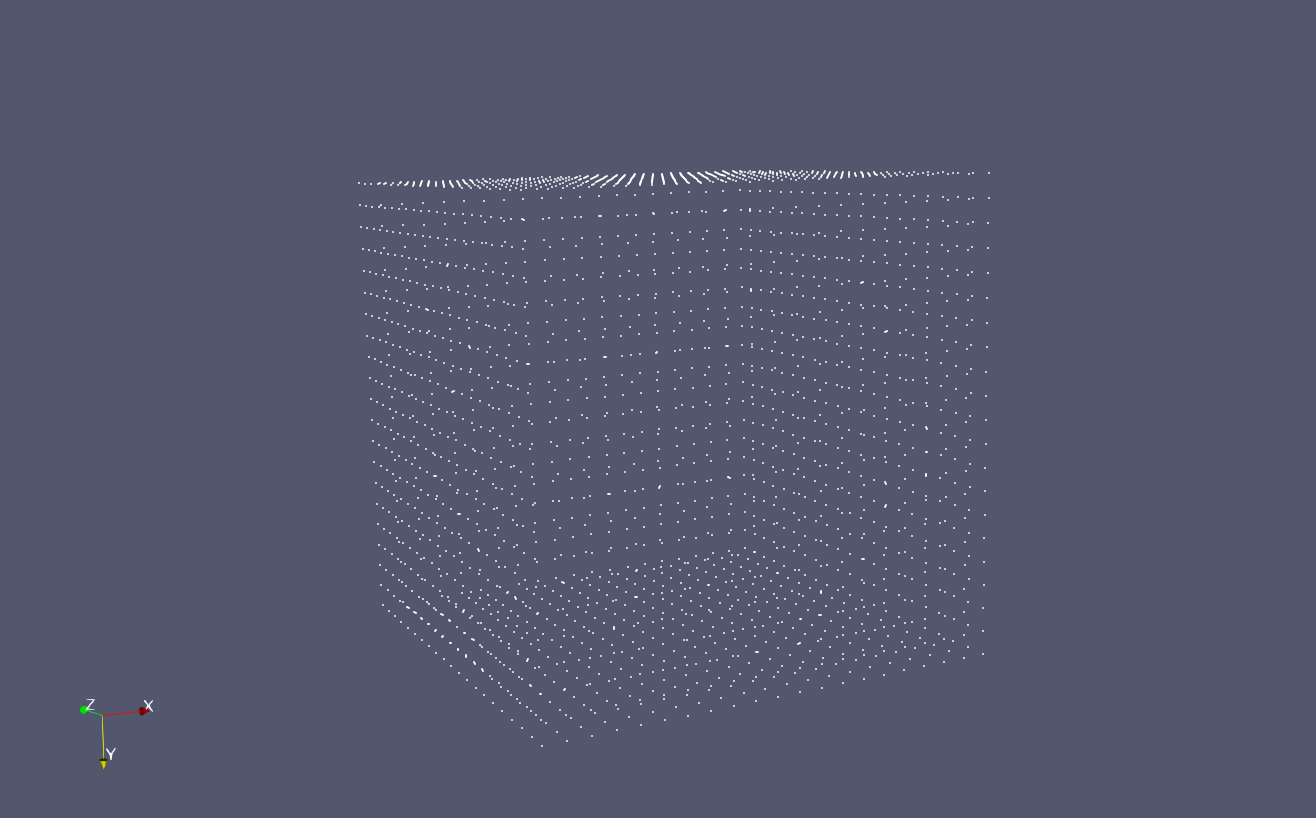
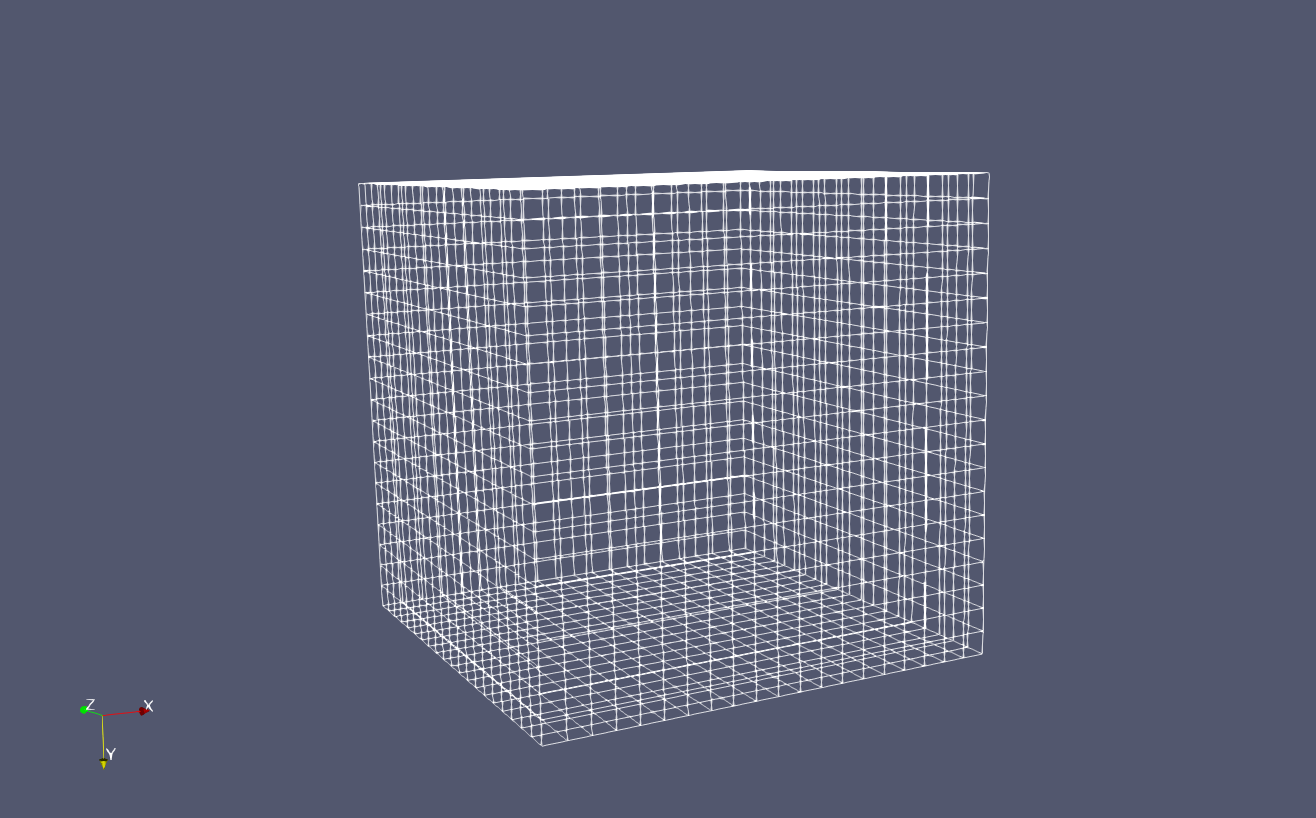
Why do the Points and Wireframe display representations only show external faces for vtkImageData and vtkRectilinearGrids? When I select Wireframe/Points, I want what the Extract Edges filter produces. And when I select Points, I want to see all points in the data set. Am I missing something here?
Also, why is there no option for Volume rendering for vtkRectilinearGrids?
Points/Wireframe Examples
To reproduce, use the Fast Uniform Grid source
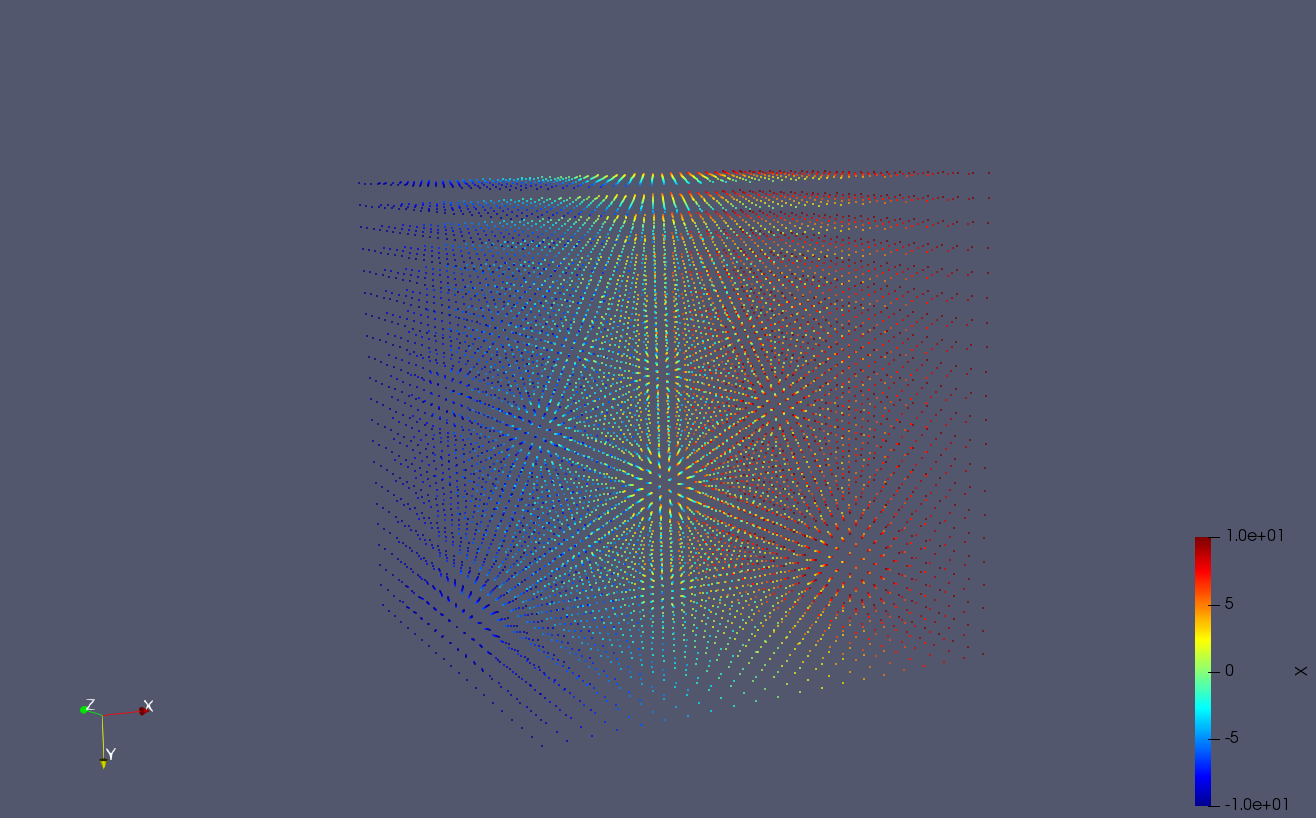
This is what I expect when selecting the Points representation. (I got this by applying an Extract Edges filter. This routine is a bit cumbersome and after generating that data object, I can’t use it down the pipeline).
Would it be possible to work around this without applying an extract geometry filter? I’m begging to realize why this is the case but I’d love a way to quickly render all the points in a dataset without applying a filter that alters the data type.
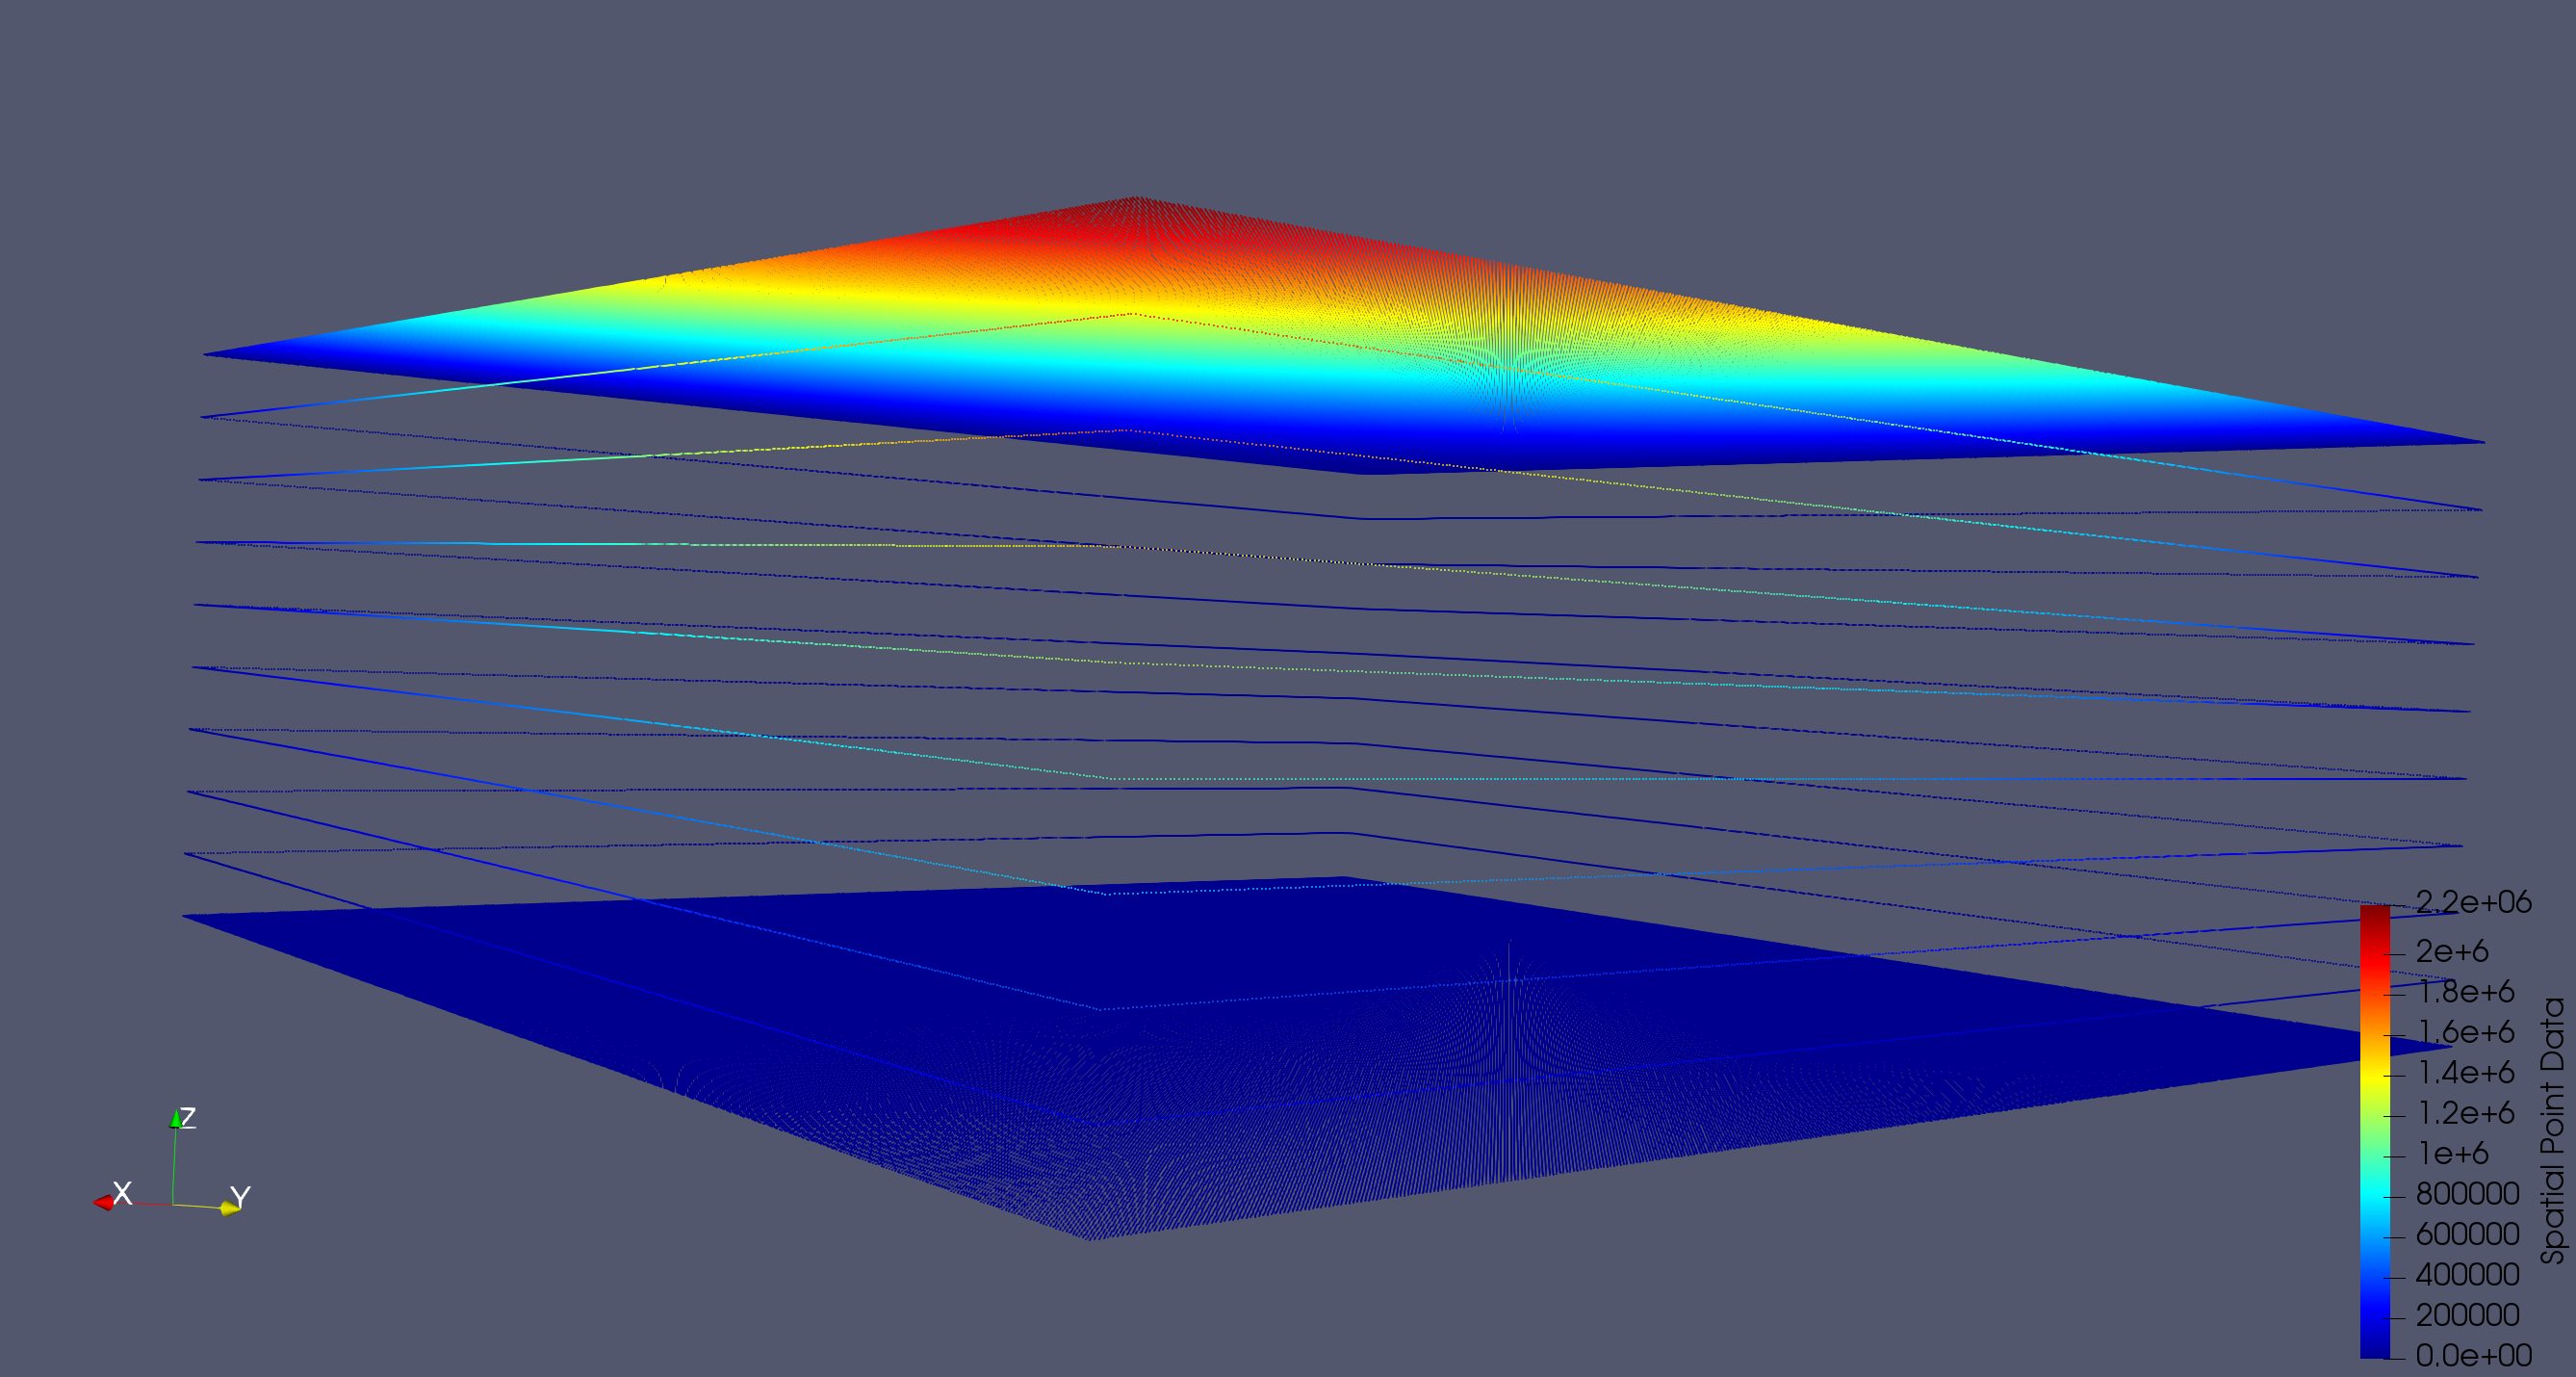
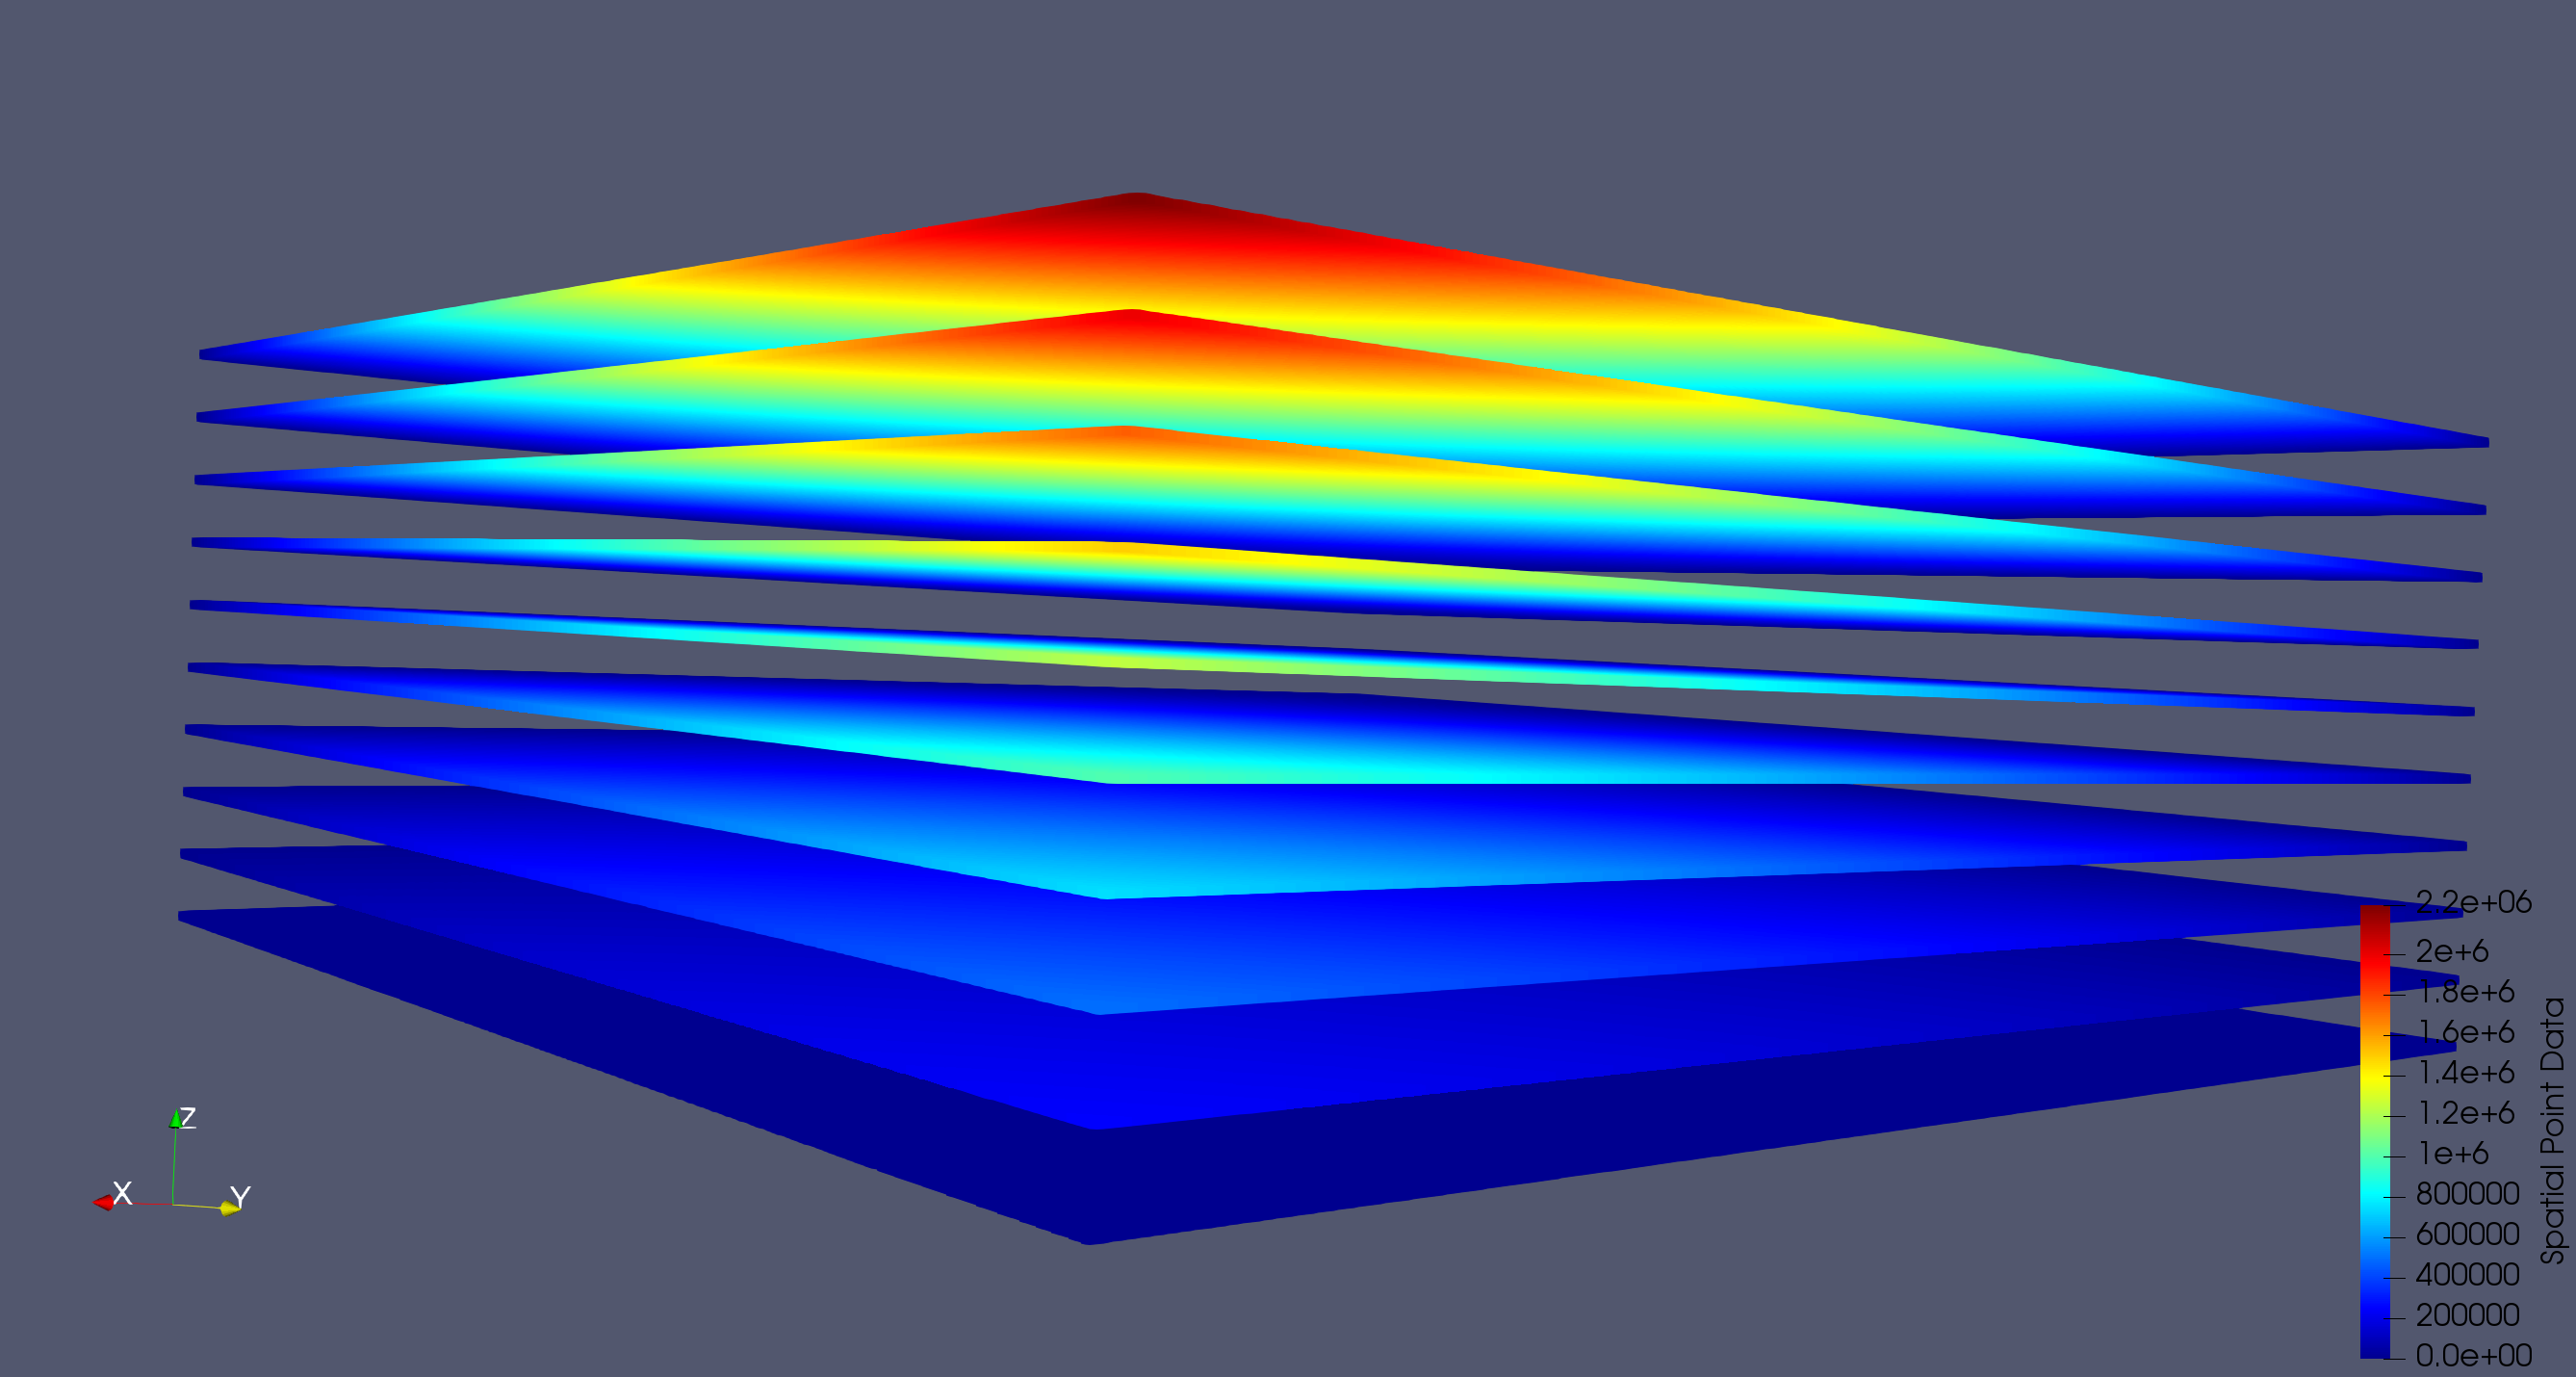
These representation types are difficult to use with datasets that have irregular geometries: for example a dataset that has dense lateral points and sparse vertical points. Take this simple uniform grid that has different spacings along each axis:
Create a Programmable Source with ImageData output:
I would like a way to quickly display all of the points in the dataset when selecting a Points representation type like the image below (this was produced from the extract edges filter):
It is not possible yet, but It would be possible to add this feature in ParaView.
You could also have this if you write your own representation plugin.
For very large datasets there are just too many points to render if you include all the internal ones. Sure, “too many” is somewhat arbitrary, but ParaView is designed for very large data where showing the internal points may not be desirable or even feasible.
As @mwestphal says, one can write a representation plugin that does show the internal points. As a faster alternative, you could also add a macro (using ParaView’s simple Python interface) that extracts the points/edges and sets the representation automatically. That would save some mouse clicks.
I totally agree with what @cory.quammen and others have said. However, I believe there is a way to get what you are looking for. Use the Point Gaussian representation. These will display your points as spheres, giving them a nicer look. You can control Point Gaussian down in the Properties tab. If this slows down your computer too much (spheres aren’t the fastest thing to draw), change to Shader Preset of Plain Circle. I would think we could add just a simple “point” Shader Preset, if there was a need.