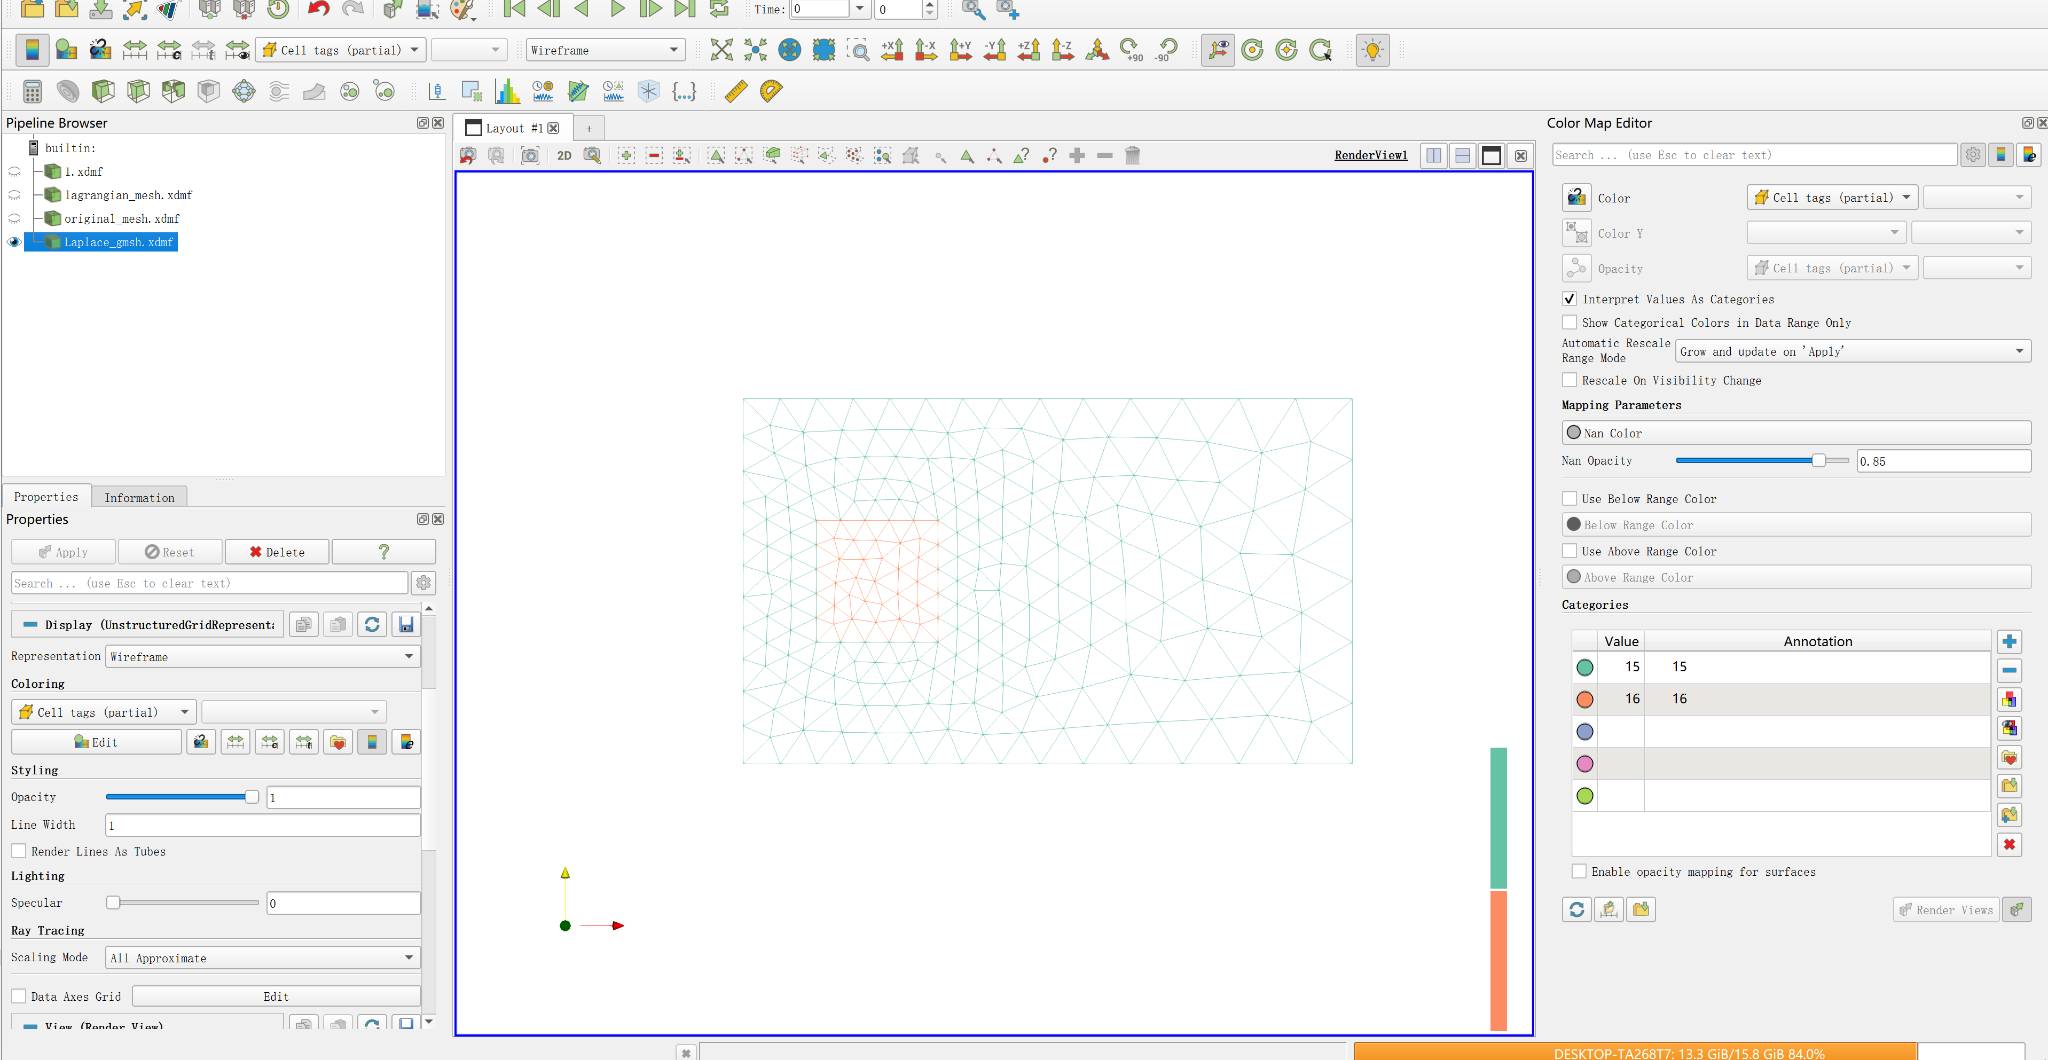
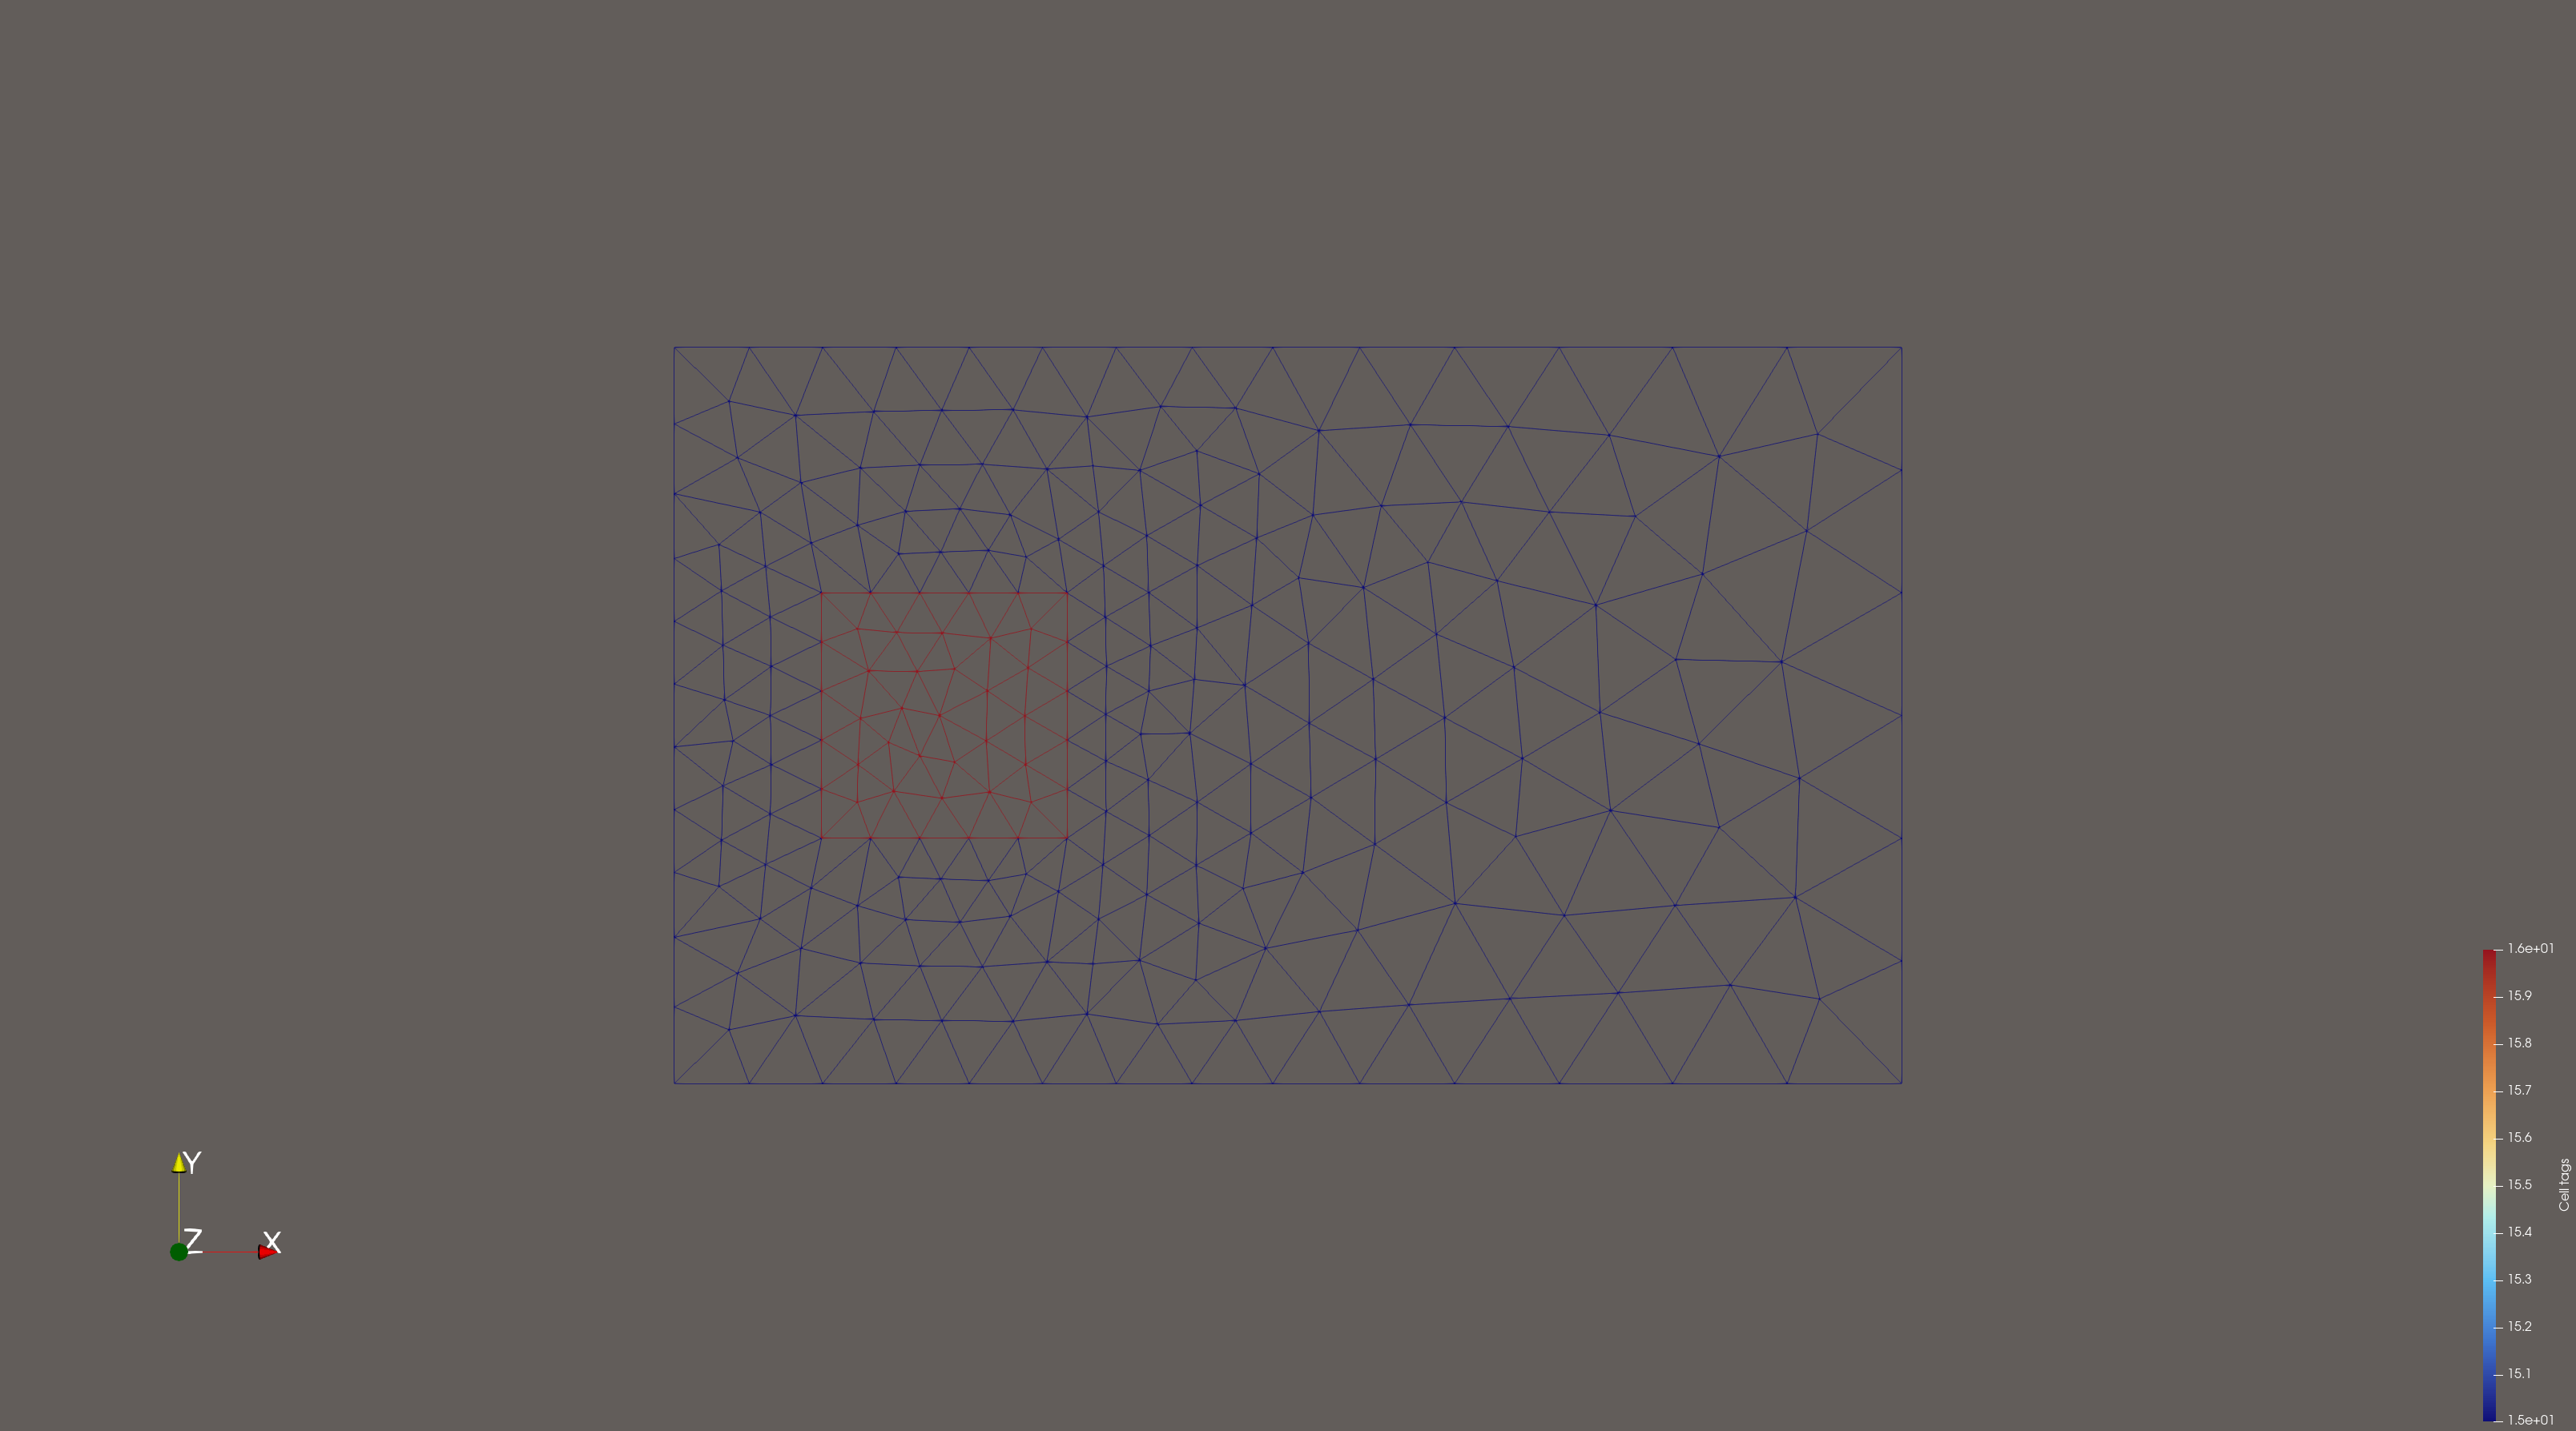
When visualizing my mesh in Wireframe mode, I color the mesh using a cell-based tag array (for example, region IDs 15 and 16). However, on the shared boundary between the two regions, the edges appear partly in the color of region 15 and partly in the color of region 16.
This results in a “half-and-half” effect on the interface, instead of using a single consistent color along the boundary.
My questions are:
Is this behavior expected in ParaView’s wireframe rendering?
How does ParaView decide which cell’s color is used for a shared edge?
Is there a way to force all shared edges to use the color of one specific region (e.g., region 16)?
I would like the interface between the two regions to show one unified color, not a mixture of both.
Any suggestions or explanations would be greatly appreciated!
Hi,
I have uploaded the corresponding .h5 files together with the XDMF files so that the full dataset can be loaded properly.
I would also like to ask for clarification regarding the shared-edge coloring issue: Do I need to assign explicit physical/region IDs to the common boundary during the mesh generation process?
If this is required for ParaView to handle shared edges consistently, I can regenerate the mesh and provide a new .h5 files with the boundary regions explicitly marked.
Thank you for your help, and please let me know if any additional data is needed.
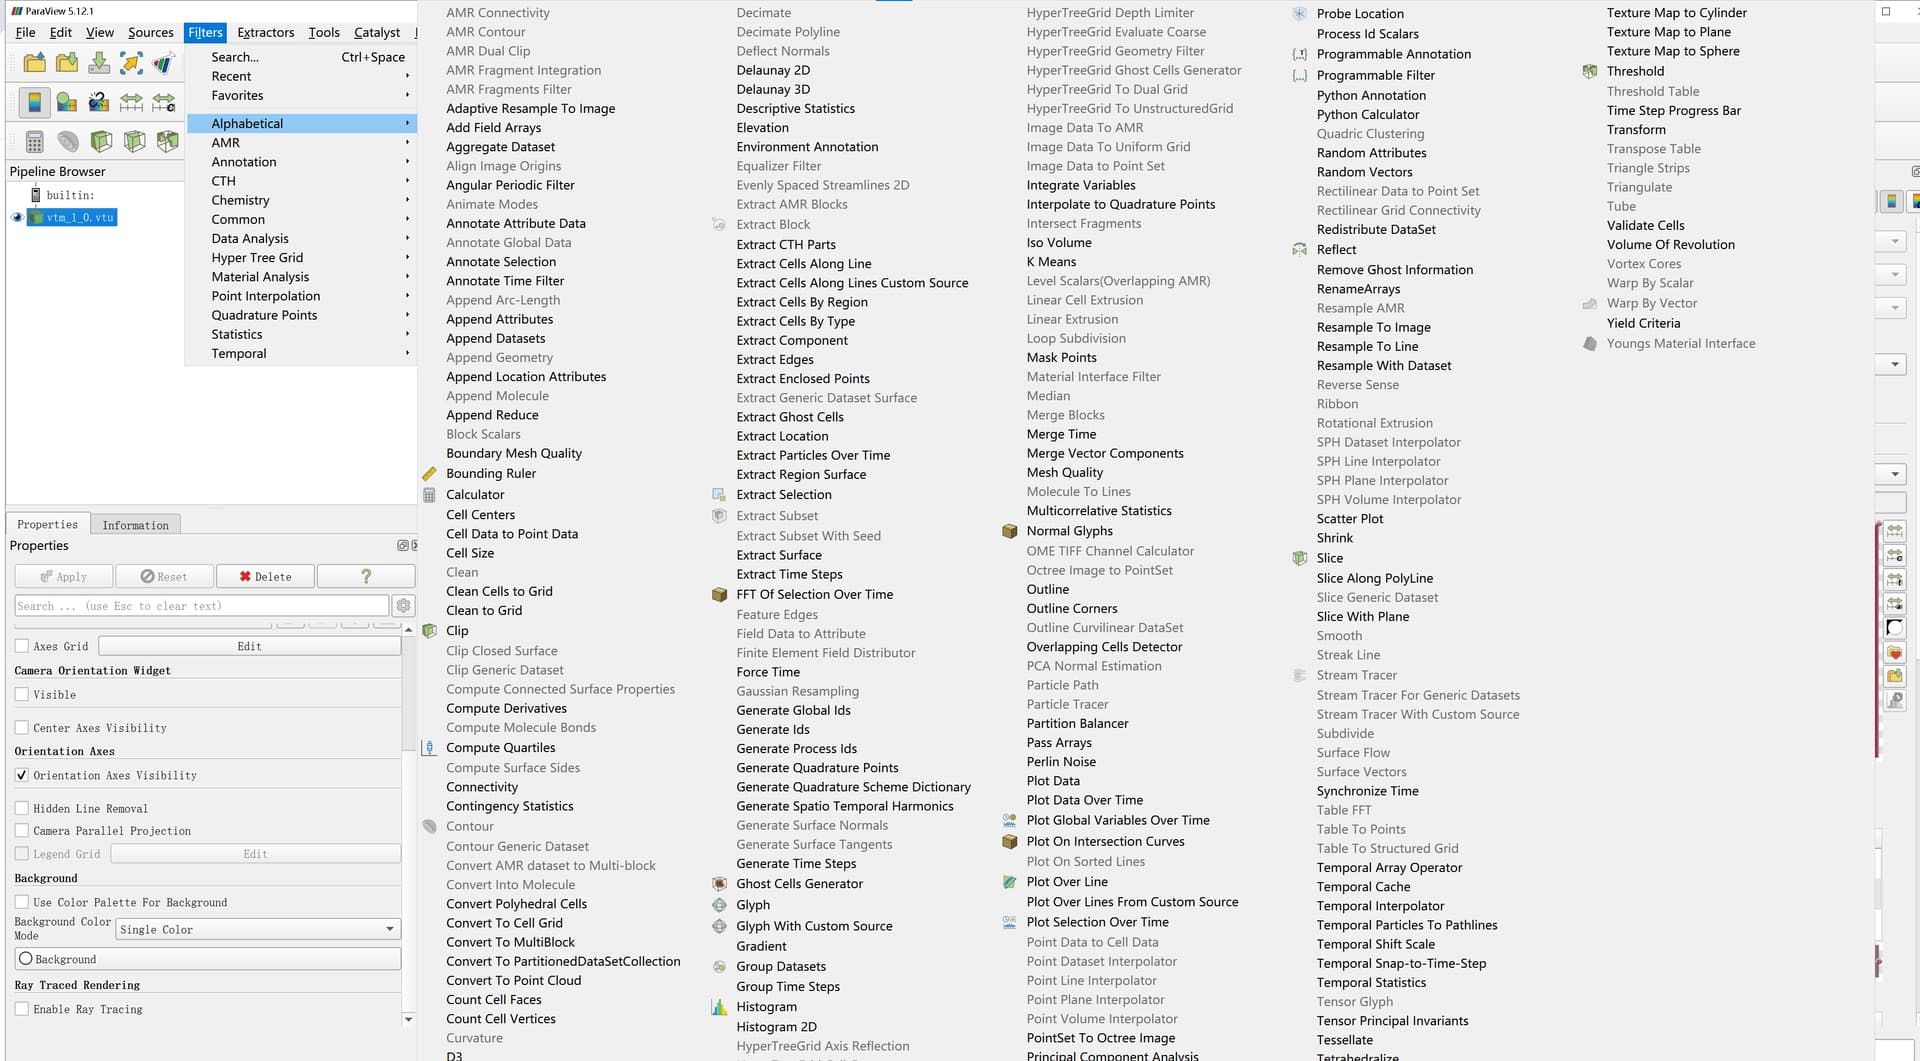
Well, no, I mean the filter called ExplodeDataSet, but its a pretty recent filter only available in 6.0 release of ParaView that you can download here: https://www.paraview.org/download/
It split a dataset into a composite dataset based on the value on the cells.
Here is how to do it:
Download latest nightly
File → open → vtm_1_0.vtu → Apply
Filters → ExplodeDataSet → Apply
Wireframe repr
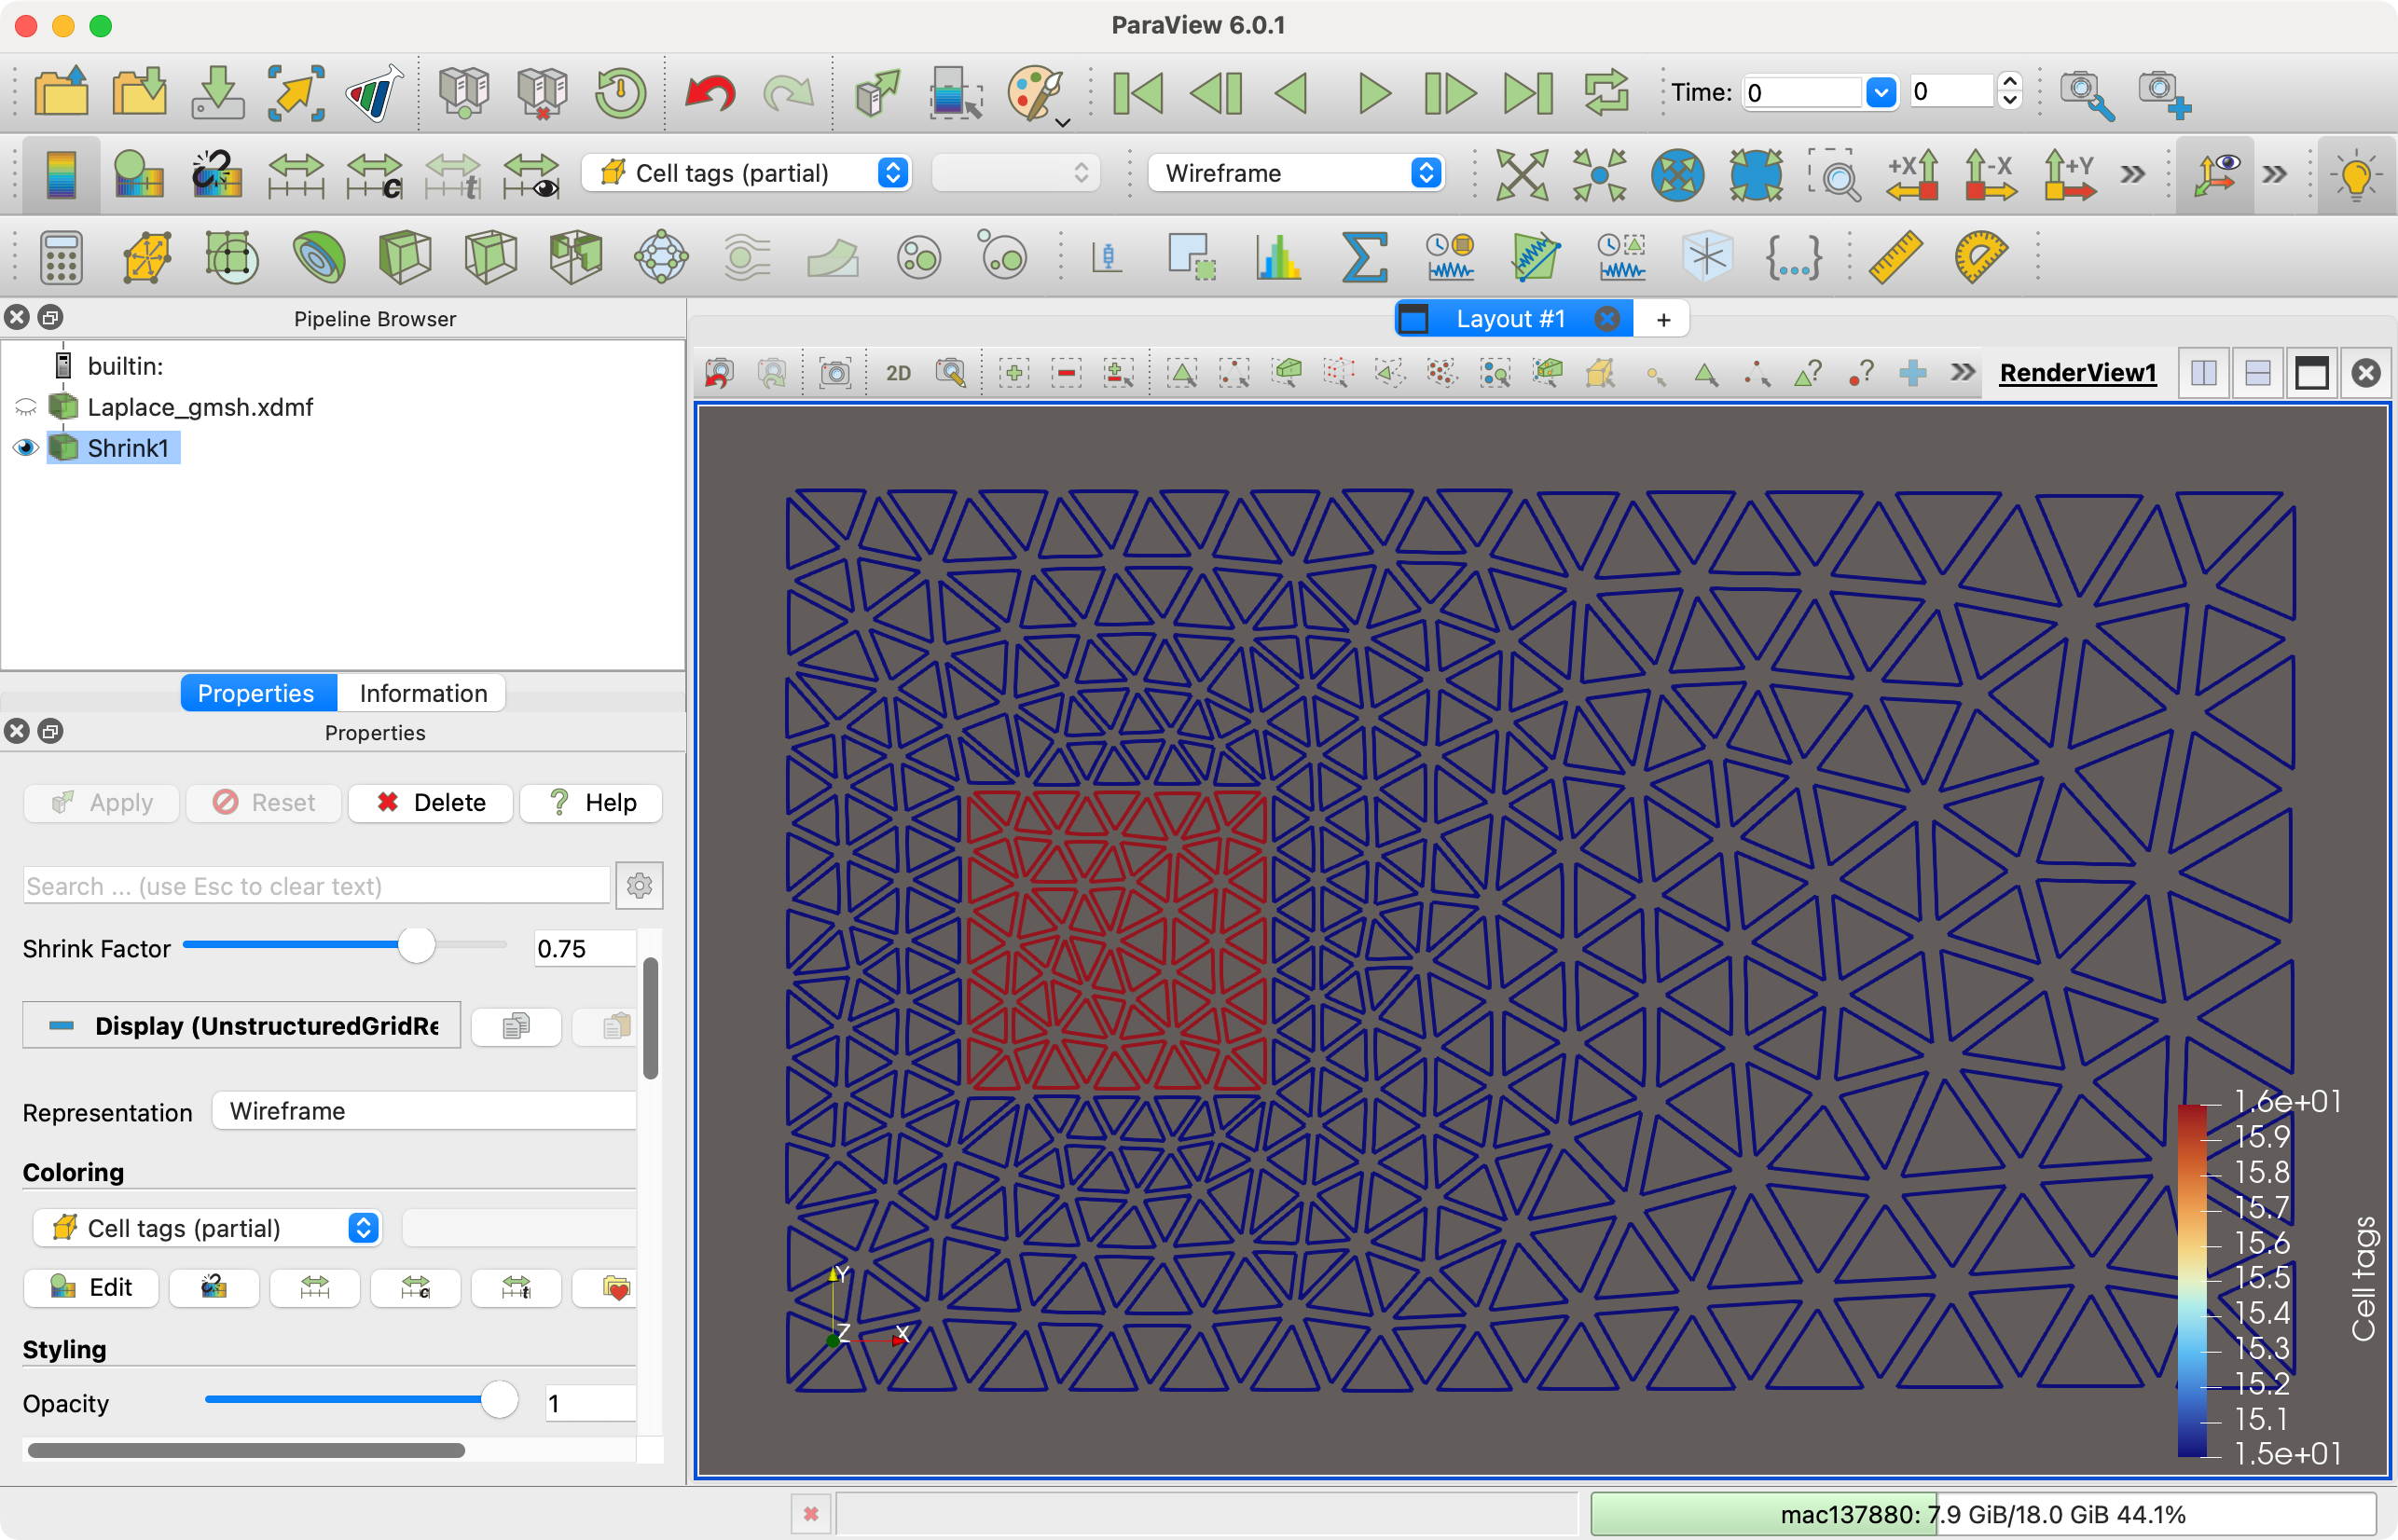
Shrink is indeed also a solution but requires gap between cells.