Hello everyone, I have two vtk files, one with openfoam solutions of gas flow and another one with electric field. I want to do calculations with expressions which combine the gas velocity from the first vtk and the electric field from the second. I tried to append attributes, append dataset and programmable filter… but I could not find a way to apply my equations with velocity from one vtk and electric field from the other. Can anyone please help with this? Thank you.
Hi @aneps, it sounds like you have two different meshes with different data fields. The best way to integrate two datasets into one is to use the Resample With Dataset filter. This filter samples data fields from one dataset onto the point locations of another dataset, resulting in a single mesh with all fields.
After you have the data arrays on a single mesh, computing equations based on values from the different arrays is possible with the Calculator, Python Calculator, or Programmable Filter.
That seems a good idea but unfortunately when I try to Resample with Dataset, I still have the parameters from only one vtk in the new resampled dataset. I couldn’t find a way to do the cross calculations. In the calculator, I have access to the data from only one case, that case where I made the calculator. I searched on youtube to find if there are any such examples, but I couldn’t find. May I request you, if you have any examples or if you know any online somewhere, kindly share it? Thanks a lot.
Would it be possible to share the files? That would help fix your problem.
yes, I have uploaded both cases in the dropbox folder. First case is in the folder ‘sample’ and the second case is in the folder ‘sampleLaplace’. The first case is just the gas flow simulations and the second case is the electric field simulations. The first case is done by cutting the geometry into half along the axis (symmetry axis) and the simulation is done only for the half geometry. The second case, in parafoam, I would like to ‘clip’ into half. Then the clipped half of the case2 is similar to the case1. I want to do the calculation on the case 2, for eg. v = 1.09* (T/273)*(760/P)*Ez , where temperature T and pressure P from the case1 and z component of the electric field Ez from the case2. I want to make a color plot of this quantity (v) on case2 (or case1, it doesn’t matter). Thanks a lot… dropbox
I am unsure whether this is what you want, but I did the following:
- Open sample_500.vtk file.
- Open sampleLaplace_40.vtm.
- Select “sampleLaplace_40.vtm” and apply “MergeBLocks” filter.
- Select “MergeBLocks1” and apply “Clip” filter.
- Select “sample_500.vtk” and apply “ResampleWithDataset”. Select “sample_500.vtk” for “Source Data Arrays” and “Clip1” for “Destination Mesh”.
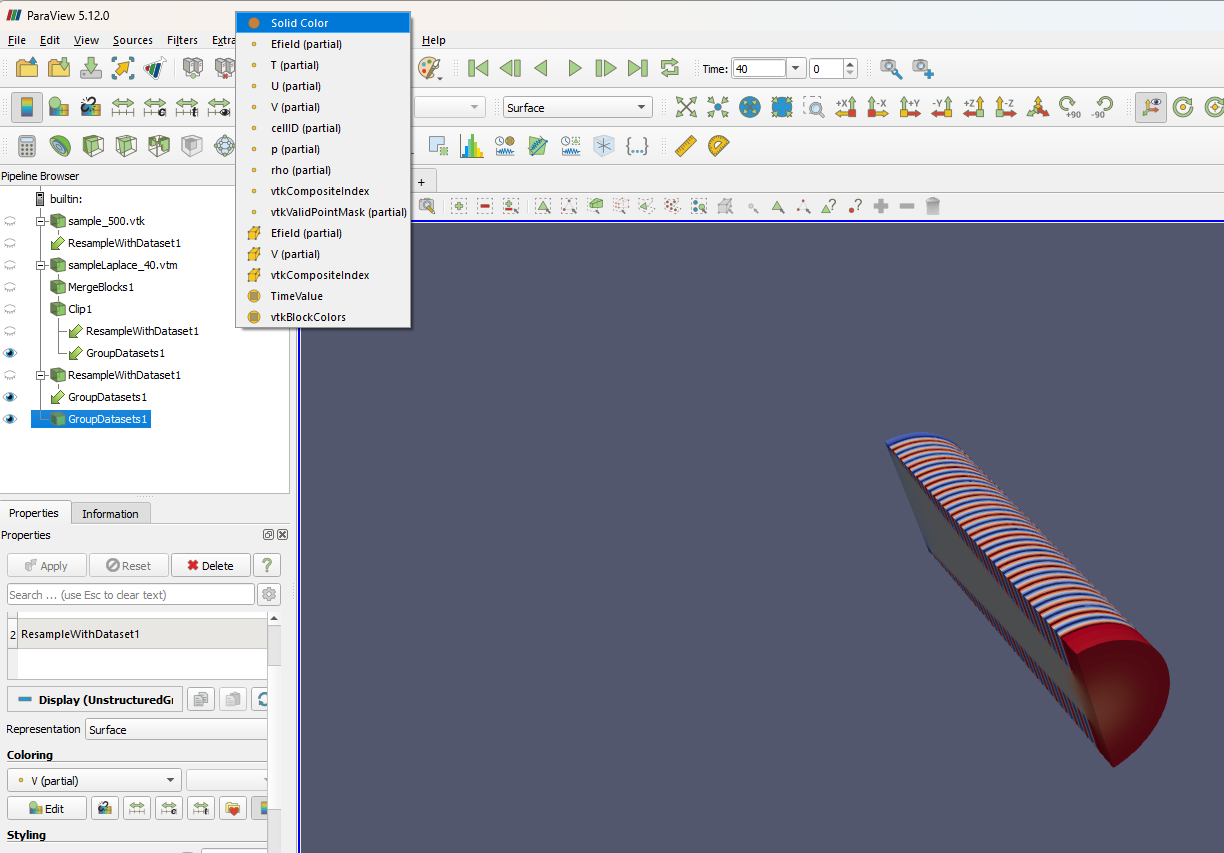
- Select “Clip1” and “ResampleWithDataset1” and apply “GroupDataset” filter.
Now I can see all variables in “GroupDatasets1”.
Best,
Hom Nath
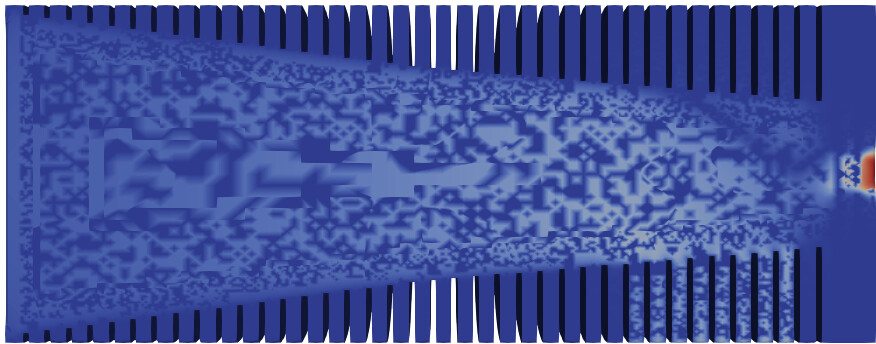
Thank you so much. For me, this is a huge step forward. But still the calculations are not possible with this. I think the issue is the data is not being resampled properly (not sure, just a guess). For eg. when I generate a calculator (on GroupDatasets1), and suppose I do a calculation Results = 1.09*(T/273)*(760/p)*Efield, then the the results just wont appear and even if it appears it shows with a question mark “Results(?)”. On GroupDataset if I just choose U(partial) for eg, then I can see a lot of cells grayed out (screenshot below). Probably this is why it cannot do cross calculations. Between, may I ask you what does it mean by ‘partial’ in the U, p, T, V etc?
The ultimate goal is to do the calculations and plot the results (colormap). If there is any other way to do these type of calculations involving parameters from both the cases, that would also be great.
Thanks once again for your valuable time.
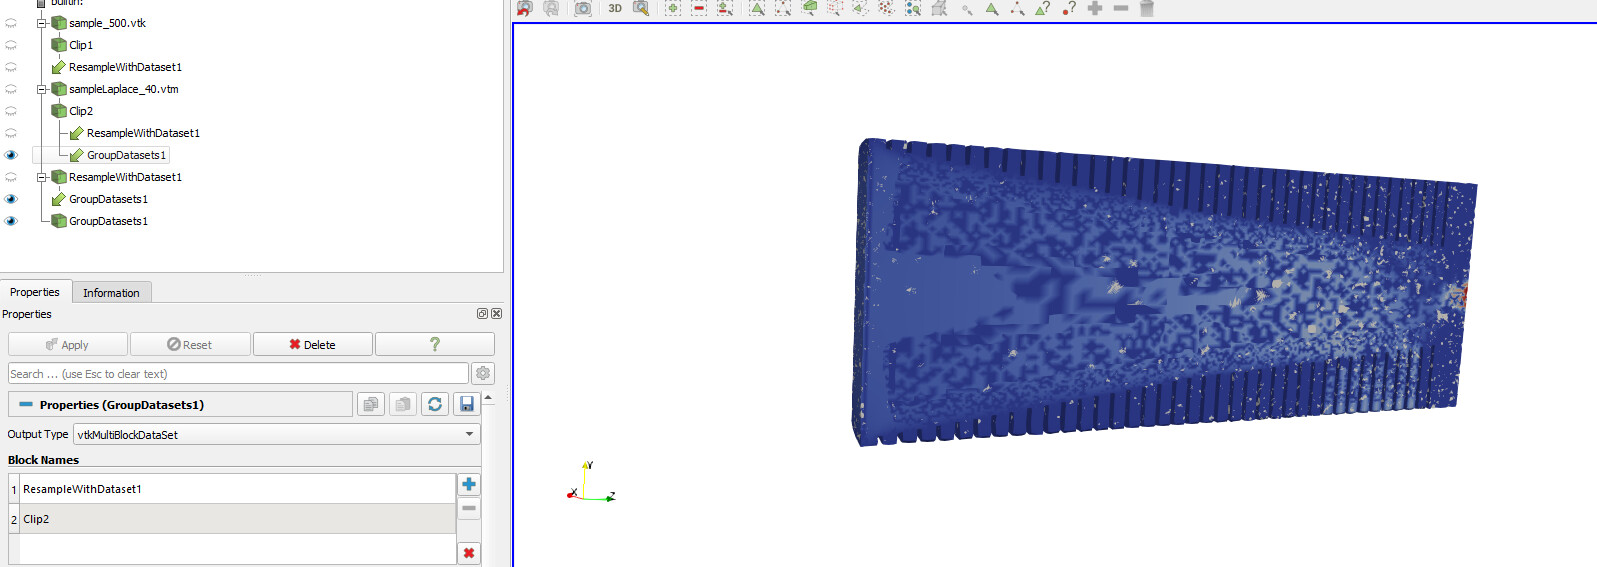
This usually happens if some regions or time steps don’t have the values to resample or interpolate. Your VTM seems to be a nonconforming mesh. I am unsure, but that may be the reason. How about trying to clip the VTK model to the shape like the VTM model (you can use the cylinder to clip) and resample the VTM model onto the clipped VTK model?
Interesting! Are you sure one mesh perfectly overlaps the other? There may be some mismatch. I will give it some more tries.
Meshes may not perfectly overlap! Because, although these both simulations are done on the same device, the boundaries are different. One is for gas flow and another is for the Laplacian. Both are meshed differently. I think that is why we need the resampling right? or else may any kind of interpolation/extrapolation methods? Thank you.
Oh, what happens if you use “Append Attributes” filter instead of “Group Datasets” ?
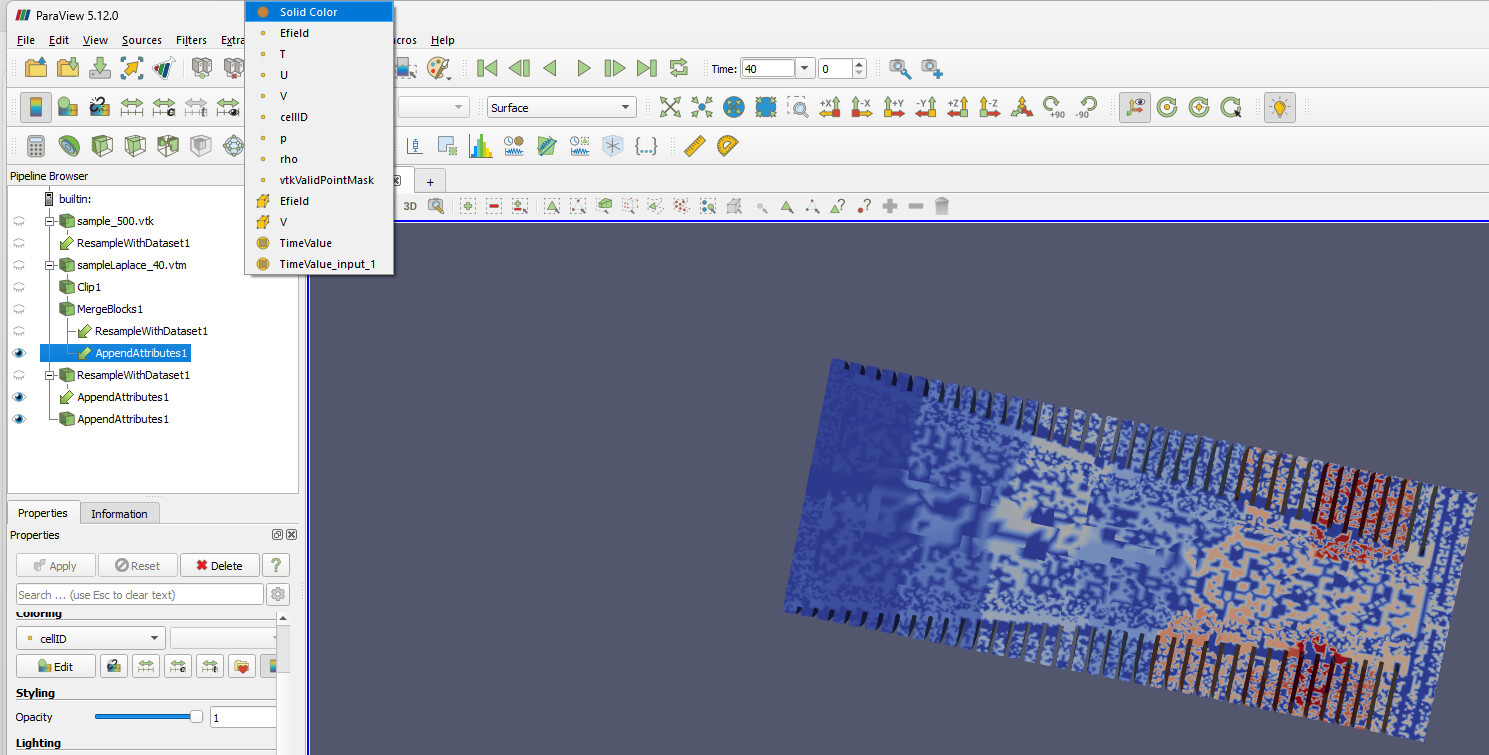
That worked, although I have data missing at several grids. Now I can do calculations, that is good. Thank you.
Great! Missing data is likely from inconsistent geometries.