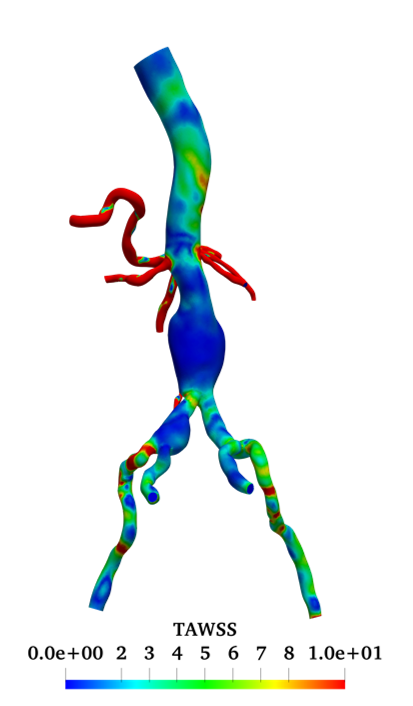
I did simulations on patient-specific models. I have calculated WSS, TAWSS, and OSI in the simulation file, but I want to plot graphs of WSS , TAWSS, and OSI on a wall in transient simulation case . Kindly help me with that.
To graph time series data, the Plot Data Over Time filter or the Plot Selection Over Time filter may be used.
By the way, TAWSS and OSI are given by \text{TAWSS} = \frac{1}{T}\int_0^T |\tau_w|dt \text{OSI} = \frac{1}{2}\left( 1 - \frac{\frac{1}{T}|\int_0^T \tau_w \:dt|}{\frac{1}{T}\int_0^T|\tau_w| \:dt} \right)
where \tau_w is the WSS vector and T is the duration of the pulsatile cycle. Therefore, since TAWSS and OSI are integral values in one heartbeat cycle and not time series data, can’t we draw a graph for each time step?