Hello
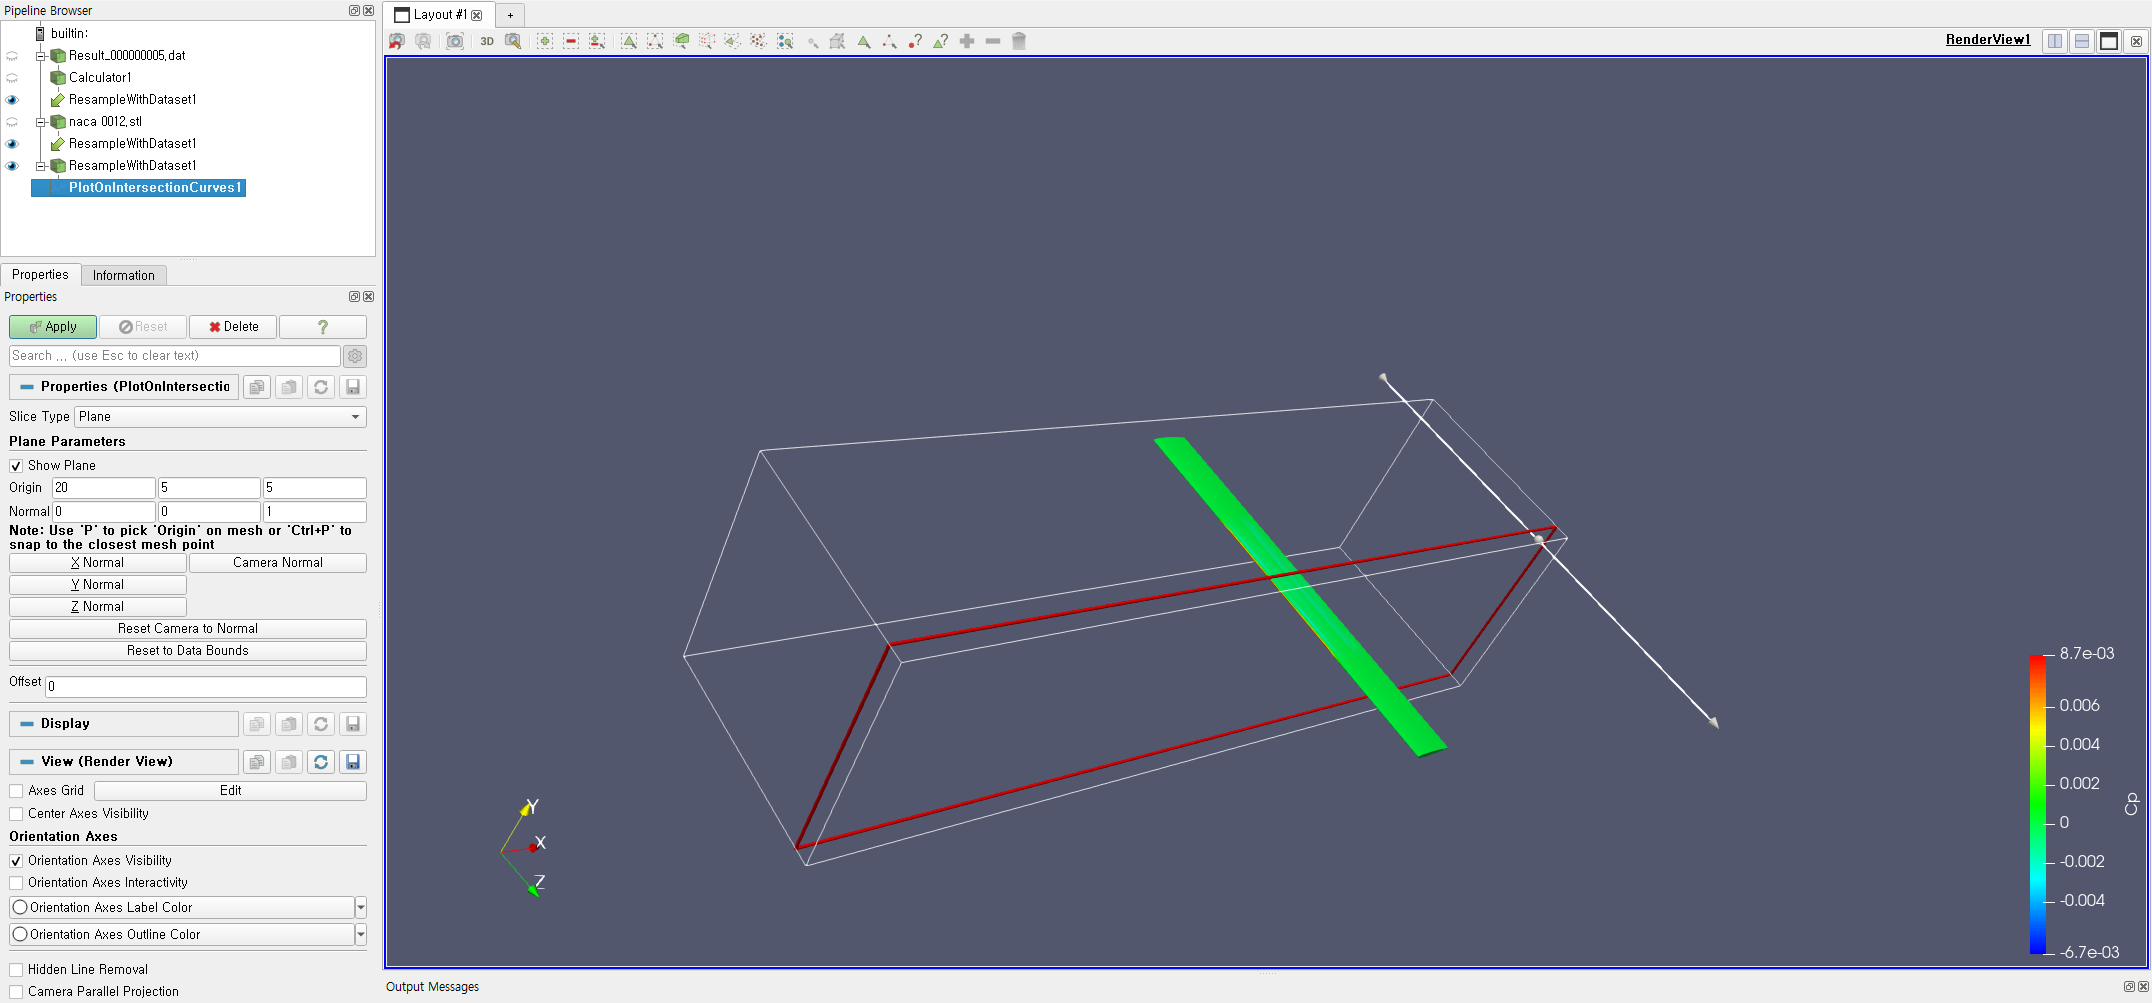
I use ‘plot on intersection curves’ for Cp on airfoil
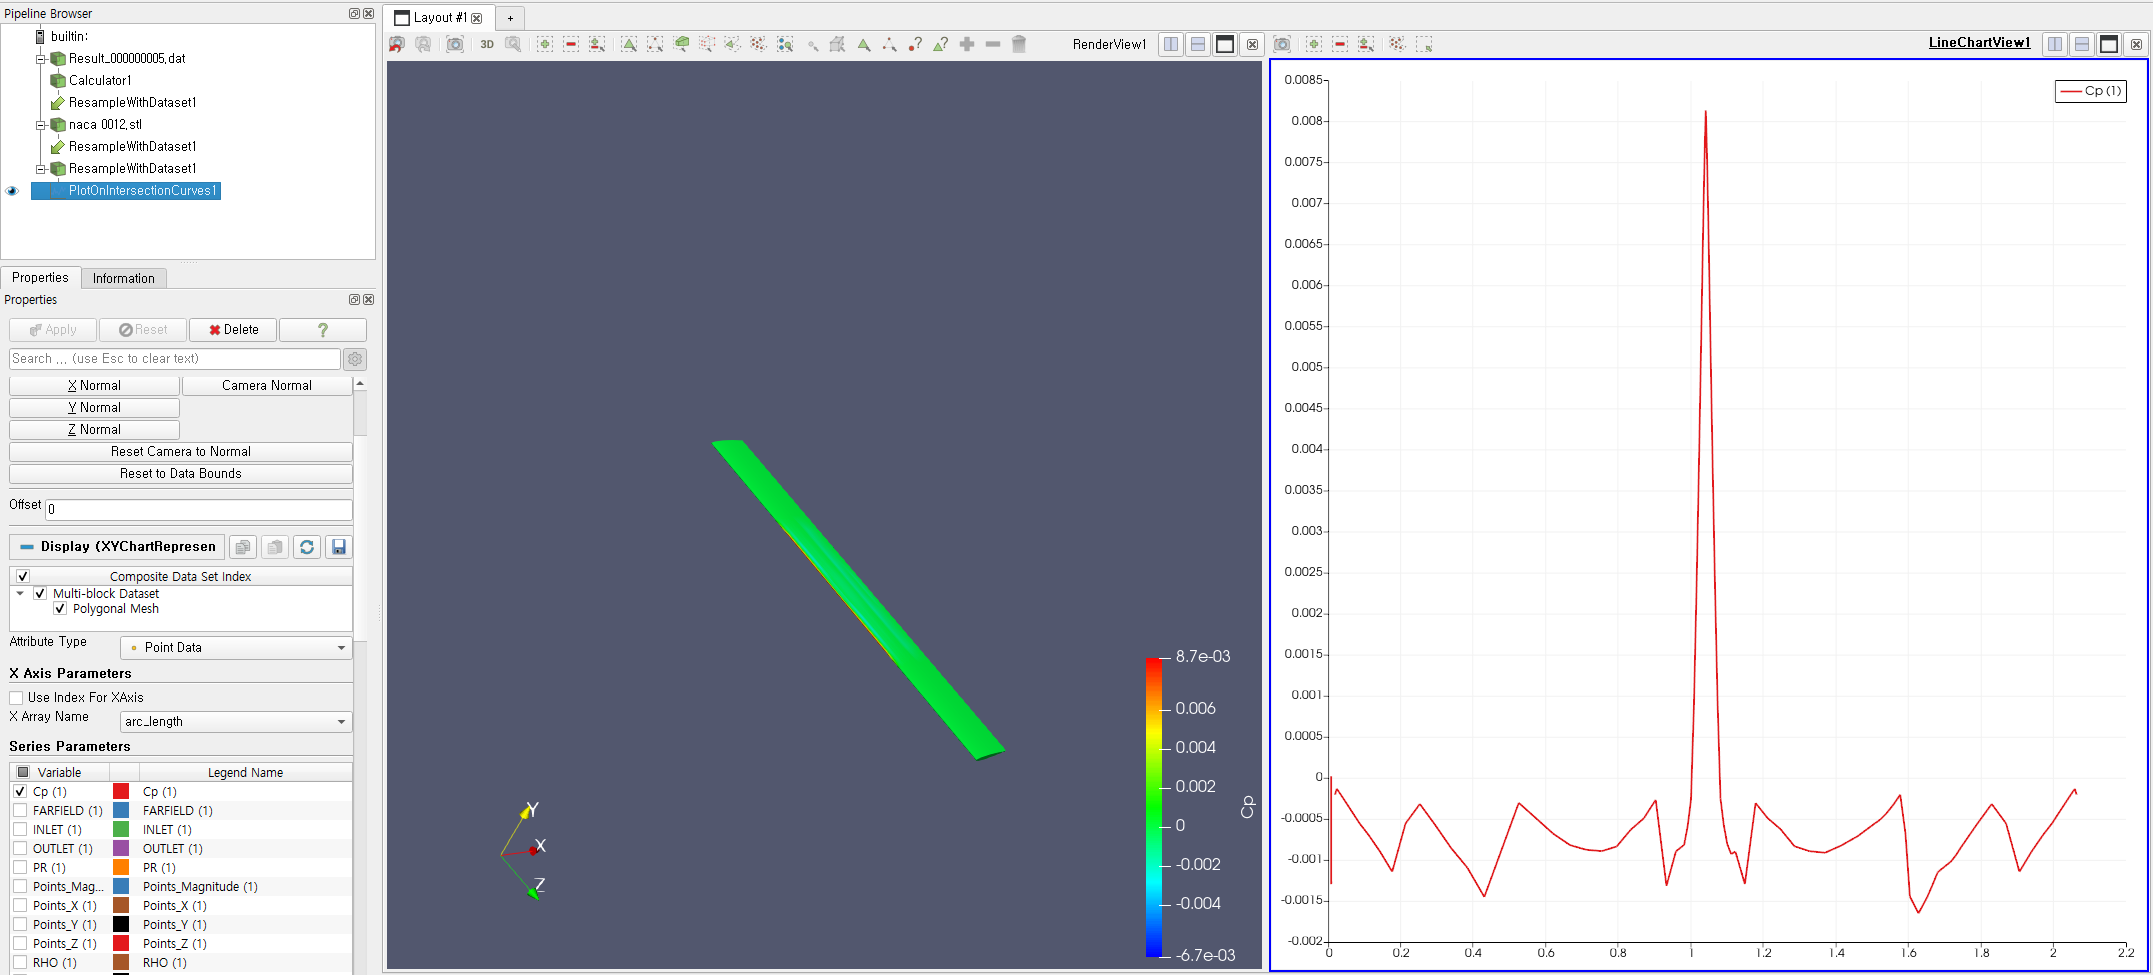
and i wonder what X axis on the graph means
on the plot, X axis is arc_length and range is about 0 - 2.1