Version 5.10.0: When using the snap to time step mode the animation is super slow, with lags when you pull manually the time cursor. Same for the real time mode, when changing the overall duration to a lower 10s the animation is only showing a sequence of 10 images out of 4497 in my case. So it seems that the glyph filter is really slow and Paraview cannot apply this filter fast enough.
Version 5.8.2: The animation is much faster for this version I don’t know why. Really it is night and day. So I guess there is a default parameter somewhere in Paraview that allows maybe Paraview to apply the filter to all timesteps before launching the animation? That’s my own interpretation.
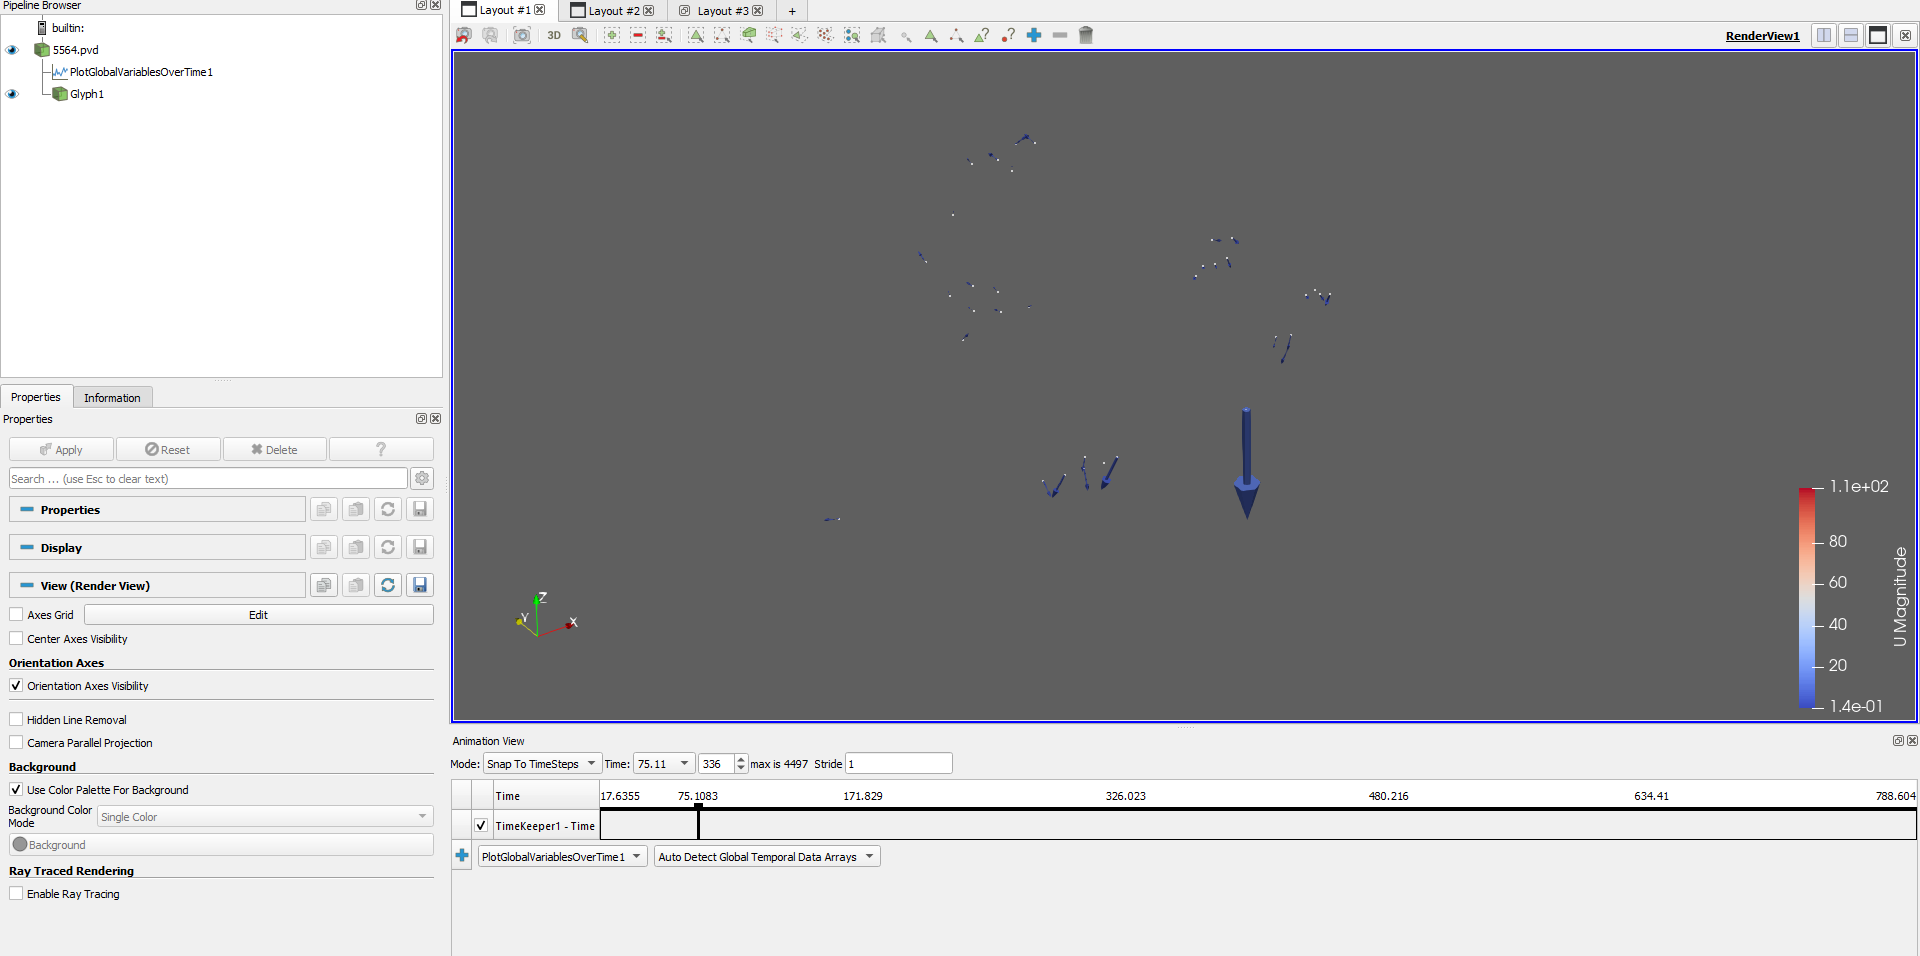
Question: Do you know if there are anything that can be done to make the animation faster on 5.10? I would like to precise that I do only one loop of the animation as it is quite long (real time is 788s).
The animation cache is on. The thing is that this animation cache is only working once you have already done one loop of visualization if I am not wrong.
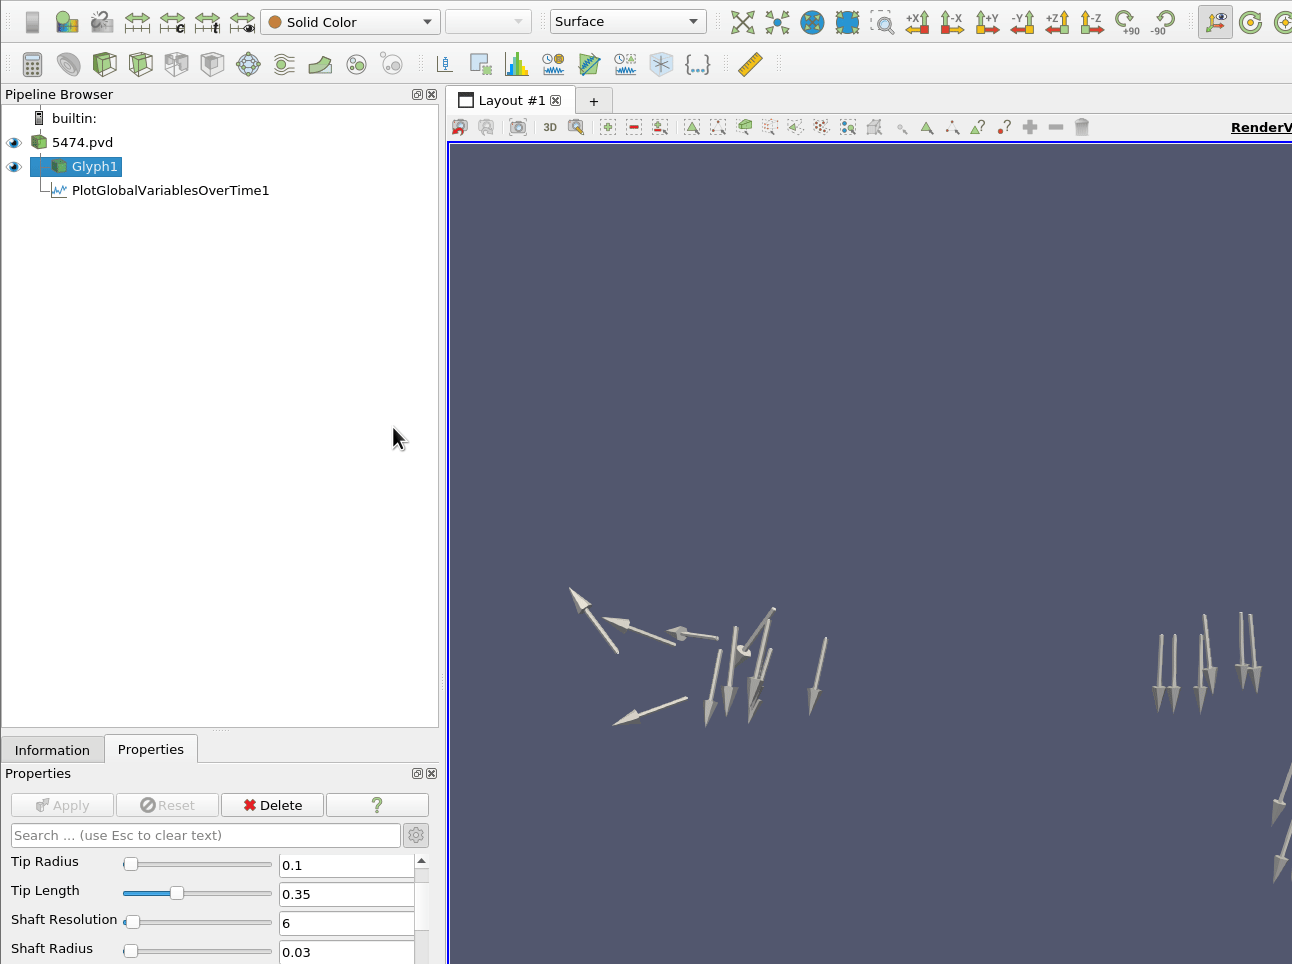
You can see the difference in animation speed below:
For your info I did the timerlog with the 5.8 version to compare with 5.10. The biggest difference is in the render view update when it executes the next pvd id. TimerLog5.8 (28.0 KB)
OK, I took a look at this. A few disjoint thoughts
I am seeing a slowdown between 5.8 and 5.10. However, it is very small. With 5.8, I’m getting around 14 timesteps per second, on 5.10 I’m getting about 11 timesteps per second. This is on my Macbook. I then tried Linux, and Linux remote server (software rendered). Only the software rendering seemed to lag somewhat, but was still extremely usable.
I tested with just play, then drug the Annotate Time time slider. Again, results were extremely similar.
Your dataset is a weird one. Time is not consistent. I believe this was not the issue, but it is strange.
My speculation is that you are falling out of hardware rendering into software for some reason.
Try deleting your configuration files. These tend to “rot”, and if you have been using paraview for years, but haven’t cleared the out, now is a good time. Edit/ Reset to Default Settings.
As a diagnostic tool, so we can add numbers to “man, this feels slow”, in the settings/ Renderview/ Advanced at the bottom is a “Show Annotation” checkbox.
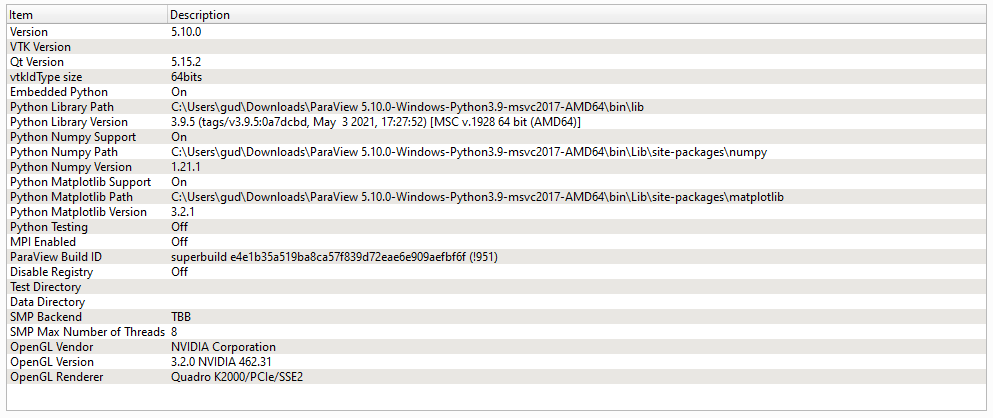
As another diagnostic tool, look in Help/ About, and look at the rendering between 5.8.0 and 5.10.0. Are they both hardware?
I tried with some other computers (always on windows) and the same issue was encountered.
The reset to default settings was not successful (I already reinstalled Paraview in an attempt to solve this problem).
The show annotation checkbox gave me this information:
Mode: still
Level of detail: no
Remote/parallel rendering: no
Frame rate: 500fps (oscillating between 500 and 1000)
As a comparison I did the same with 5.8 and the frame rate is constant at 1000fps, no oscillation at all.
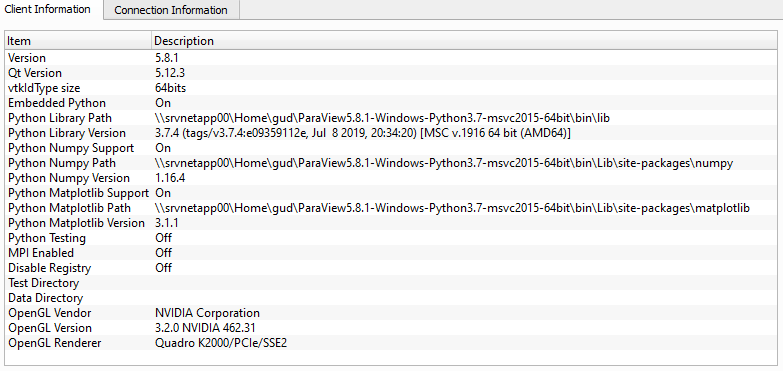
Looking at the About section, I could not spot any difference between 5.8 and 5.10 (you already have a screenshot of the about section of version 5.10 a few messages above). I then put here 5.8.