I am trying to generate random LIC pictures with the paraview surfaceLIC plugin
I have something scripted in python that outputs a matrix of custom dimensions (usually 2000x1000) that represent the velocity field.
Now would be cool to use paraview to generate LIC pictures from these fields, and I see two possible ways:
Call the paraview plugin from my code so that it outputs a matrix that I can save as picture from python itself
Export the fields as a vtk object and script it to get the LICs as usual
Would you maybe have any suggestions? I am a bit concerned about the second options because it would become maybe too slow to generate huge amounts of data
you’ll always need at some point to convert your custom matrix to a VTK data structure if you want to use the Surface LIC classes. Now you can either :
or create a vtk python script that create your matrix, convert it to a VTK object, and write it on your disk so you can visualize it later on ParaView.
You shouldn’t need to worry about the size for a simple 2000x1000 matrix except if you’re on a very old laptop, this is still a small dataset
What I could do in the meantime is to get a source plane in vtk with as many points as my matrix, get the points as a numpy array and then do operations on them.
Are there any examples on how to manipulate point data and shove it back in the vtkPolyData object then?
It seems that the LIC works on point data and not cell data, so maybe it has more sense to build the matrices with points, do the operations and then create the surface with like a Delaunay2D?
For storing 2D or 3D matrices I’d advise you using a vtkImageData
I don’t think there is (or at least not to my knowledge), because this is an unusual operation : since ParaView is supposed to run on remote (and possibly multiple) servers, memory management from a paraview script is not trivial.
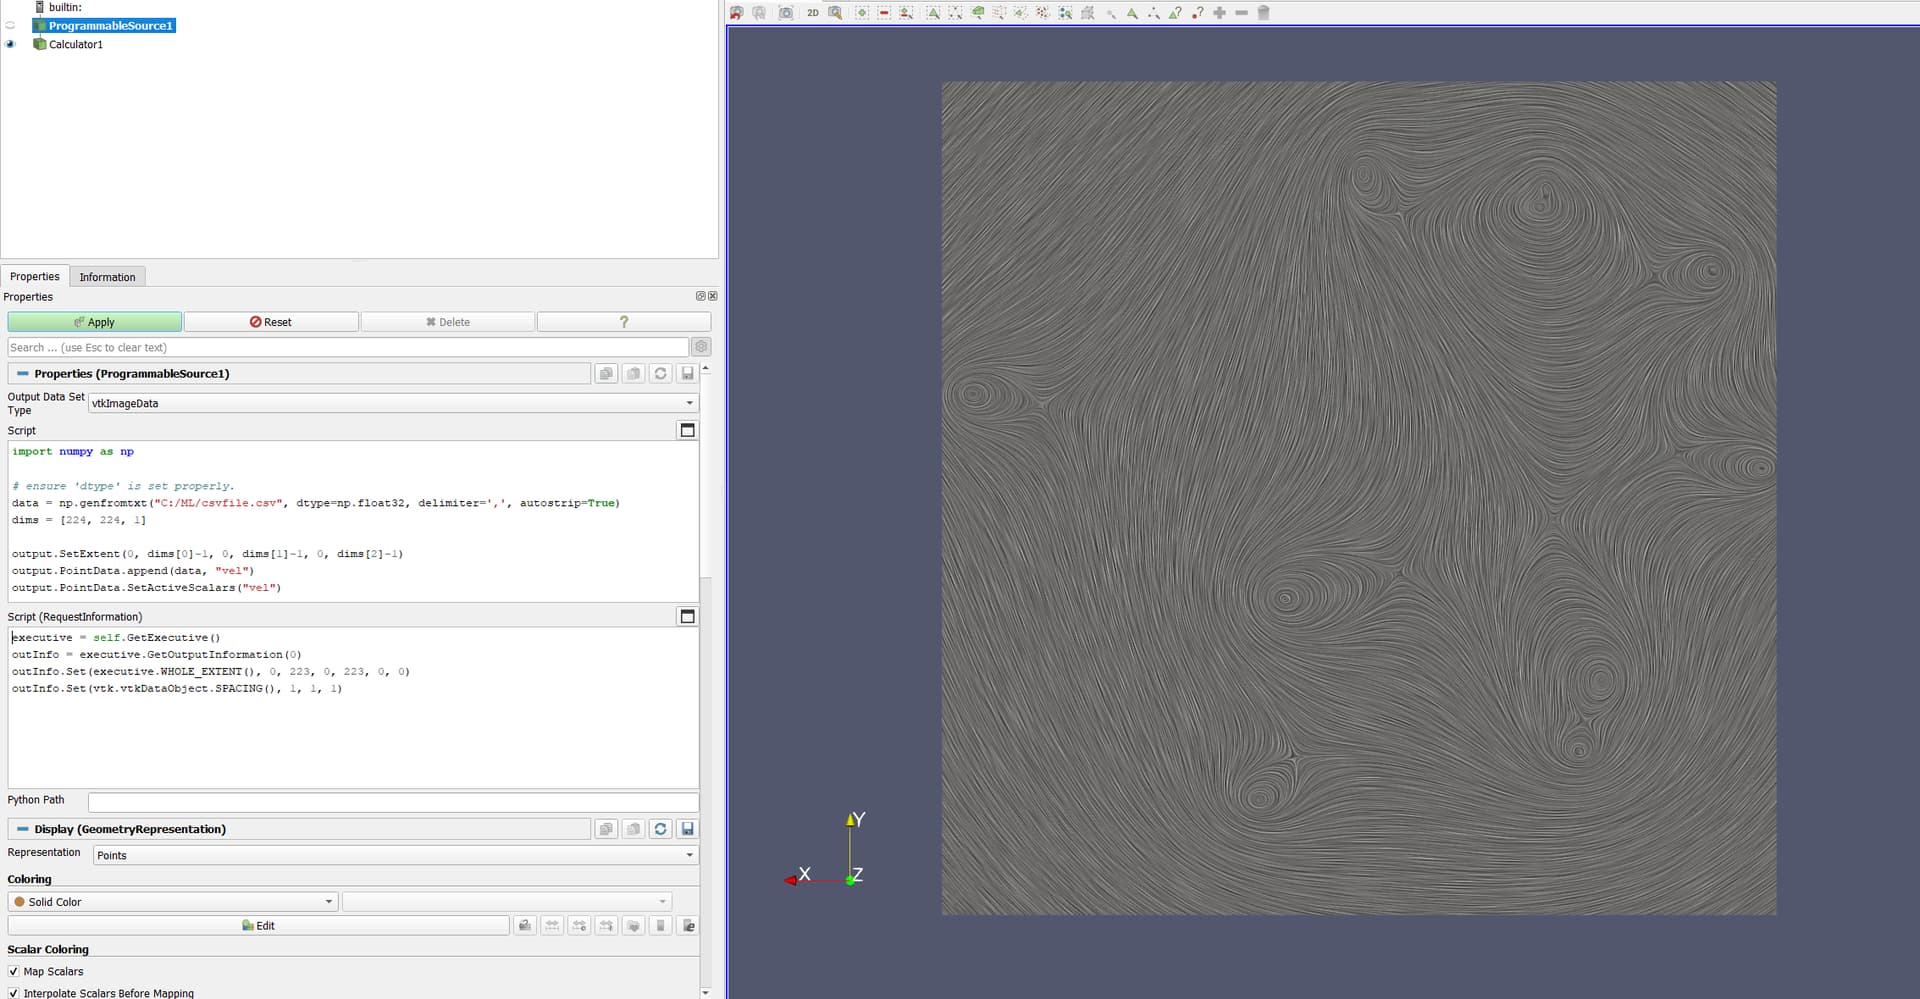
For example you can create a Python Programmable Source, copy paste your script that creates your data and convert it into a VTK object into the programmable source, and you should be good to go
Using a Delaunay2D seems overkill here. Maybe I didn’t understand what you’re trying to visualize but as I said in the beginning of my message a vtkImageData should be able to represent matrices quite well.
Basically I calculate my velocity fields with python, export them as a cfd file with the columns: x,y,z,u,v,w for the points and the velocity and then parse them. Then I recompose the velocity vector by running the calculator with uiHat+vjHat+w*kHat
Proabably there is a way more efficient way to do it, maybe exporting the velocities in the correct vectorial way (which I didn’t found) and using the TableToStructured filter which I couldn’t make work sadly
Glad that you made it work as you wanted ! Indeed this may not be the best way since you’re wrinting your file to your disk. If you want to improve your workflow further consider the solutions I’ve mentioned in my previous answer.
Also if you have multiple timesteps for your velicity field, know that you can export your CSV files as timestep1.csv, timestep2.csv, timestep3.csv, … and when trying to open a datafile ParaView will group them and import them as a temporal dataset (see 2. Loading Data — ParaView Documentation 5.10.0 documentation).
If you think your issue is gone do not hesitate to mark this thread resolved
Yes I will definitely try your way as well and update the thread just in case someone else needs it!
I think the biggest difference in our approaches is that mine creates the points at first and then does a Delaunay to get the grid. I found a tutorial by westgrid here which was helpful on creating sources but I couldn’t yet get it right
May I see an image of your dataset with the representation Surface with Edges (or even the csv file if you’re ok with sharing it publicly) ? I think I’m misunderstanding the layout of your data
you do not need to define any points or use a delaunay2D. Since your points follow a uniform grid pattern, point position can be implicitely defined and this kind of structure corresponds to a vtkImageData.
For an example of how to create such an image data from a numpy array see 5. Programmable Filter — ParaView Documentation 5.11.0 documentation . The paragraph actually explains how to create a 3D vtkImageData, but it’s mainly the same for a 2D image. The only thing that will change is the shape of your numpy array as well as the WHOLE_EXTENT (Z extent = 0 in your case)
Can confirm that it works even with the programmable source, seems even way faster!
The example code needed only some small changement, the dtype is actually very important and should be set correctly to the datatype, it took me half an hour of debugging to understand it
Now I am pushing the components of the velocity vectors as scalars and then reassembling them in paraview with a calculator. Is it maybe possible to append the vector directly? Starting from numpy arrays I can’t really figure out in which kind of structure they need to be manipulated in
Is it possible to retrieve the vtkImageData from the programmable source in some way?
I would need to pass it through vtkImageMapToColors and then vtkPNGWriter and apparently it is a different type of object straight out the programmable source
It is because you’re talking in term of VTK filters while we are in the ParaView world. I suspect you don’t need vtkImageMapToColors or vtkPNGWriter at all when in ParaView. Please open a new topic explaining the full context and what you’re trying to achieve exactly.
Thank you @timothee.chabat I already did because I thought it was a complete different topic, although I think I might not have used the right terminology also in that post…