I use open-source FEA software CalculiX. One of its limitations is that it can only output averaged nodal stresses. I’ve noticed this recent thread about Quadrature Points filters that can be used to obtain stresses at the integrations points which is really great: How to interpolate array data using gauss points (quadrature)
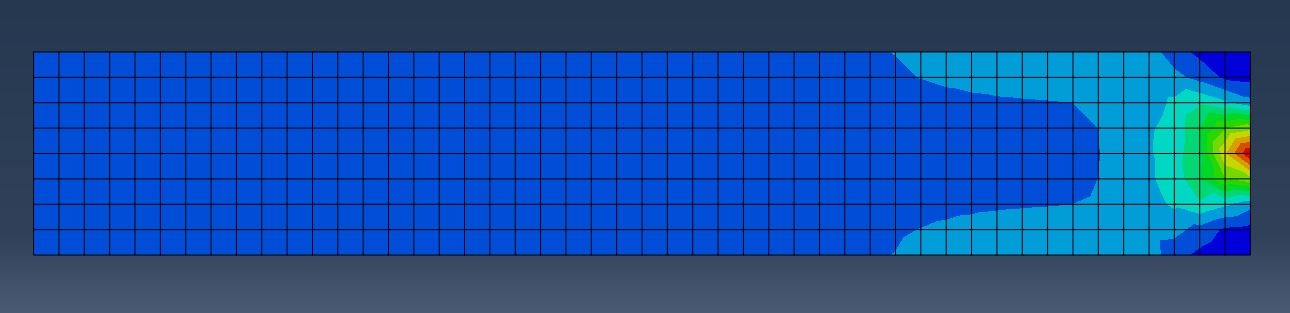
However, I would be also interested in turning averaged nodal stress output to unaveraged stress output (so just removing averaging). Is that possible in ParaView ? It would be very useful since we often turn averaging off in commercial FEA software to see the discontinuities in the stress field:
Thank you, the plot created with Point Data to Cell Data filter is indeed similar to what I want to achieve but there is some significant difference that makes me wonder how the internal computations are performed when compared with commercial software:
The filter just averages the data values of all the points defining a particular cell.
Each averaging operation creates loss of precision. To get the original data, you should have additional information or some super-resolution algorithm.
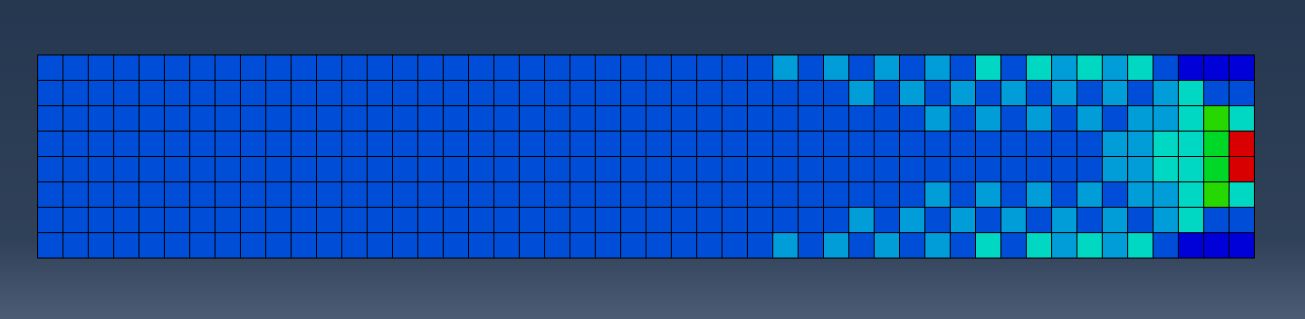
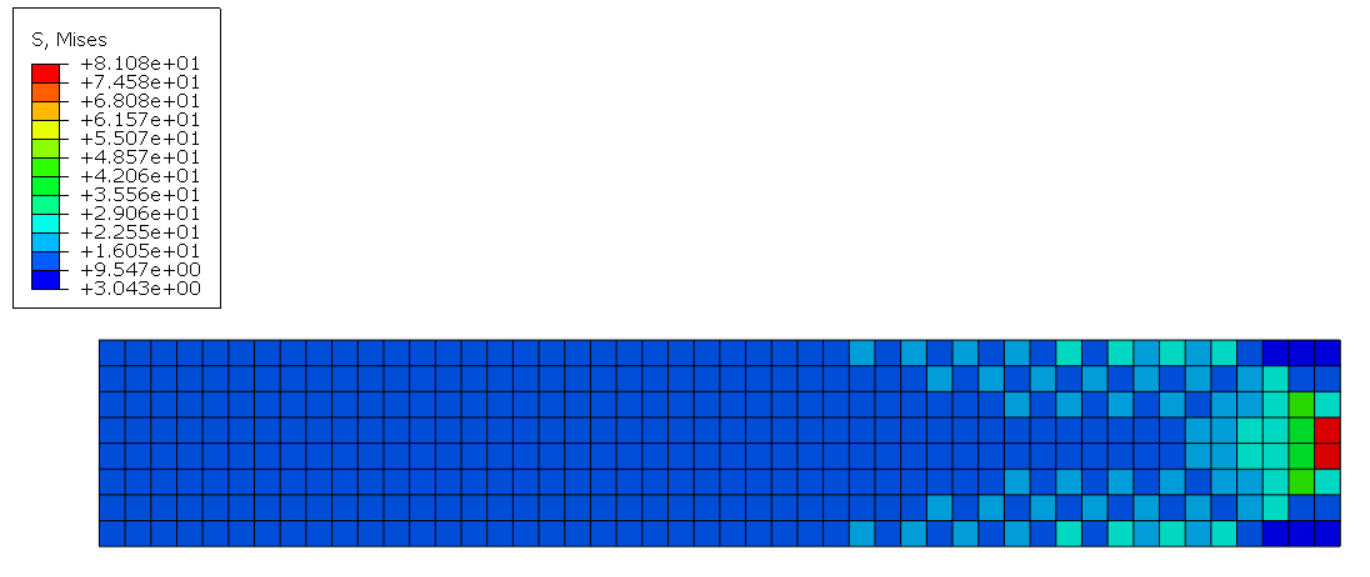
Abaqus, it has an option to turn averaging off completely. Normally, stresses calculated at element integration points are extrapolated to nodes. Since a node can be shared by multiple elements, results from them are averaged at each node. This averaging can be turned off so that values are extrapolated to nodes from integration points but not averaged. And a plot like the second one in my previous post can be obtained. I would like to achieve the same thing in ParaView.
So it seems that I would need different filters since my data is averaged nodal. Maybe a sequence like this could help:
Generate Quadrature Scheme Dictionary
Interpolate to Quadrature Points
Cell Data to Point Data - but here averaging would have to be turned off somehow
The FRD file is for nodal results, and I believe they are averaged. You obtained this file using *NODE PRINT.
The DAT file is for element results. You can get this file using *EL PRINT. The element data are at the Gauss points (and are not averaged), as you mentioned. I believe you have to dig into the element type to find the locations of the Gauss points, but that may be easy. Let us say that the data is numbered and then can be like a scalar or vector or tensor. That is, you get data in some (scalar, vector, tensor) form at each Gauss point.
ParaView can read in all the element data. You will then need to do some processing on this data afterwards, such as extrapolating from the Gauss data to the nodal locations. I don’t know of any built in filters for this.
One way to extrapolate stress from the Gauss points to the nodes is to examine the stresses at the Gauss points, say 4 points. Fit a bi-linear equation that is actually the shape functions for the linear quadrilateral to these 4 points. Then compute the nodal values.
It has been about 30 years since I’ve done this extrapolation, but my memory is that you fit a function that is one order lower than the element order. For example, if a quadratic (8 node) element is used, then fit a bi-linear function. If a linear (4 node) element is used, then average all the Gauss point data and assume that the simple average is applied everywhere within the element. RD Cook’s 2nd edition discusses some of this on page 137.
Indeed, the .frd file contains averaged nodal stresses and that’s the problem here - I need unaveraged ones. However, this kind of output is requested using *NODE FILE and *EL FILE keywords. On the other hand, *NODE PRINT and *EL PRINT are used to request output to the .dat text file where stresses are reported at the integration points (but in a form of a table).
That would be needed for .dat file. If there was a way to map values from there to the mesh, then extrapolate to nodes (without averaging) and visualize in the same way as those from the .frd file (contour plots), it could be a workaround for my problem. ParaView has the Cell Data to Point Data filter but it likely applies averaging which is not desired in my case (and I don’t know if it’s possible to use it on the results imported from a text file). I tried using the opposite filter (Point Data to Cell Data) but the results would have to be extrapolated to nodes without averaging and that’s where I’m, stuck.
I think we are on the same page, but I was not clear enough.
Starting with the DAT file from *EL PRINT that provides stresses at the Gauss points, we then need to extrapolate to nodal values. It seems custom from this point on, and I don’t know of any existing filters that do this for you. I have interchanged Gauss points and integration points as the same in my notes.
Here is one way that seems UGLY and is a hack. For each element, add a list of unique nodes that make this element. The nodal list would then become nearly 4 times too large, since there are duplicate nodes. Now for each node, put the un-averaged stress values for that node. The grid must be unstructured to do this. Make sure ParaView does not merge nodes. You can test this step by adding a random stress for each element and see the colors in the contour plot.
Now for each element, we need to extrapolate to the nodal values. For a linear quadrilateral element, average all the stresses at the Gauss points, and then use this one average for each of the nodes. Test if ParaView displays this model correctly. Each element should have a constant color. You can also use this simple test for 8-node elements.
Now, if you used a quadratic 8-node element, likely then you may have 4 or 9 Gauss points. You can test the graphics scheme by doing something wrong, like assigning the nodal value as equal to the stress at the closest Gauss point. This is wrong, but your plot will show a stress distribution within a cell (element). Here is a more correct way: You know that stress is one degree order less than the displacement field, so quadratic displacements imply linear stresses. Thus, curve fit a bi-linear equation to use at the node points. For example, stress = C_0 + C_1 * x + C_2 *y + C_3 *x *y. If you have 4 Gauss points, then there are four equations and 4 unknowns and you can solve this. If there are 9 Gauss points or some number higher than 4, then use least squares. Once you have your C_0, C_1, C_2, C_3 constants, you can extrapolate to the nodes. The curve fit could have used the standard linear shape functions.
If the quadrilateral element has fewer than 4 Gauss points, let us simply assume it is a constant stress element and just use one average value everywhere.