How to interpolate array data using gauss points (quadrature)

I need to interpolate a result (stress) using gauss points.
I understand that I should use Quadrature Scheme.

I’ve created a quadrature definition:

vtkNew gauss_points_triangle;
gauss_points_triangle->Initialize(VTK_TRIANGLE, 3, 3, Ngauss3, Wi);

where 3 is the number of nodes, 3 the number of quadrature points, Ngauss is an array with the shape functions of each gauss points (dimension=9), Wi is the quadrature weights (dimension 3).

Afterwards I create an offset:
vtkDataArray* offsets = layer->GetOffsetsArray();

Afterwards I create my array with stress results (my unstructured grid contains 2 triangles):

vtkNew Stress_si;
Stress_si->SetNumberOfComponents(1);
Stress_si->SetName(“Stress Si”);
Stress_si->InsertNextValue(1385);
Stress_si->InsertNextValue(847);
Stress_si->InsertNextValue(1385);
Stress_si->InsertNextValue(847);

Afterwards I connect the quadrature scheme with Stress array:

auto* key = vtkQuadratureSchemeDefinition::DICTIONARY();
key->Append(Stress_si->GetInformation(),gauss_points_triangle);
Stress_si->GetInformation()->Set(vtkQuadratureSchemeDefinition::QUADRATURE_OFFSET_ARRAY_NAME(), offsets->GetName());
Afterwards I add stress array into unstructured grid.
ug->GetCellData()->AddArray(Stress_si);

I think that the vtu file is correct:
example_vtk.vtu (2.4 KB)

However when I open this file in paraview I do not know how can I show my stresses interpolated.

I’ve found three filters in paraview:

  • Generate quadrature scheme dictionary: it appears the following error message:
    “Filter data has not been configured correctly. Aborting”.

  • Generate quadrature points: I can show my quadrature points:
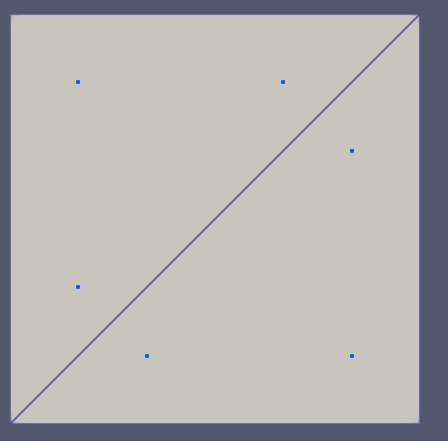
    image

  • InterpolatetoQuadraturePoints: it appears the same error message than using Generate quadrature scheme dictionary.

I do not how can I use these filters or another way to show stresses interpolating to gauss points.
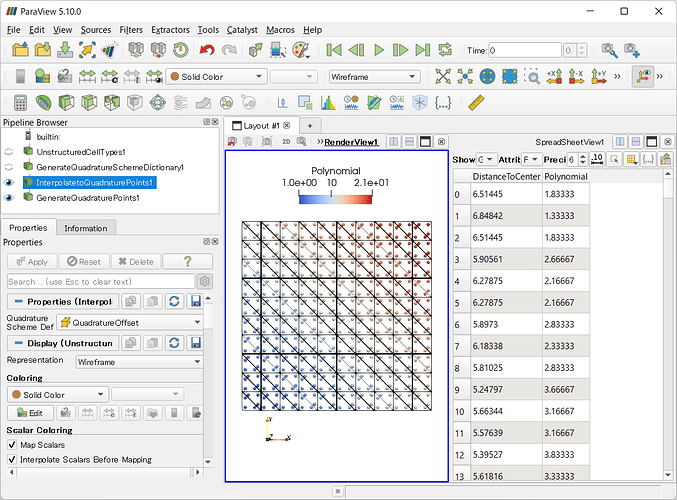
The Interpolate to Quadrature Points filter interpolates the data at the points onto the gauss points of each element. Therefore, first load the mesh data that has scalar or vector values at nodes into ParaView. Here, note that you do not need to prepare the definition of the gauss points in advance. This is because the gauss points of your triangles are the same as the ones provided by the VTK library by default (see link below), so just run the Generate Quadrature Scheme Dictionary filter and the gauss points will be set.

Next, apply the Interpolate to Quadrature Points filter to interpolate the nodal data onto the gauss points. (The interpolated values will be saved as Field data, and you can check these values by specifying the Field as Attibute in SpreadSheet View.)

Finally, use the Generate Quadrature Points filter to generate real gauss points, and you will see the interpolated coloring in the Render View.

The following is an example of using the above three filters.
quadrature_sample.pvsm (642.5 KB)

2 Likes

First of all, I would like to express my gratitude for your answer.

My problem is that I have values at cells, specifically in the gauss points, for example stresses. I cannot to interpolate these values to nodes because I could have different values in nodes. I would like to write my values in gauss points in a vtk file and then open this file in paraview and see these values interpolated in all element surface.

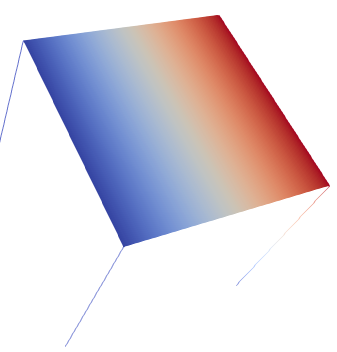
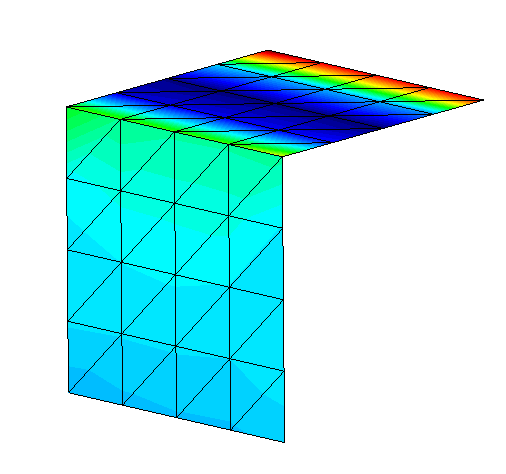
For instance, the following image shows the stress result written at gauss points and these stresses are interpolated over the surface.

image

Thank you very much for your help

Does it make sense to use Point Dataset Interpolator only for gauss points in your case? (Or do you not have values (e.g. ‘stress’ property) for these gauss points?)

I have values for the gauss points and I need how can I write these values in gauss points in a vtk file and then open it using paraview

For example:

For a stress value I have:

GaussPoints “Triangles” ElemType Triangle
Number Of Gauss Points: 3
Natural Coordinates: Internal

Result “Shells//Stresses//Top//SI” “Static” 1 Scalar OnGaussPoints “Triangles”
Unit “Pa”
Values
1 1385.88453
1385.88453
847.603318
2 1385.88453
1385.88453
847.603318
End Values

I need to write this information in a vtk file and then open this file using paraview

In order to interpolate the values at gauss points onto the surface, I think we need to interpolate them onto the nodes first. Unfortunately, the ParaView and VTK libraries do not include such a feature (although it is not difficult to implement). To achieve the desired visualization, you may need to use other methods that do not embed the gauss points in the vtu file.

1 Like

When you extrapolate stresses to nodes you can have several values for each node depending on the cells around it.

Moreover I do not understand which is the usefulness of quadrature scheme. When you have values in nodes, then paraview interpolate this values on the surface of the cells.

For example, in the following image the displacement (displacement is a value calculated in the nodes) is shown:

image

In the following link it is possible to access a document where the quadrature scheme is explained:
https://vtk.org/Wiki/File:VTK-Quadrature-Point-Design-Doc.pdf

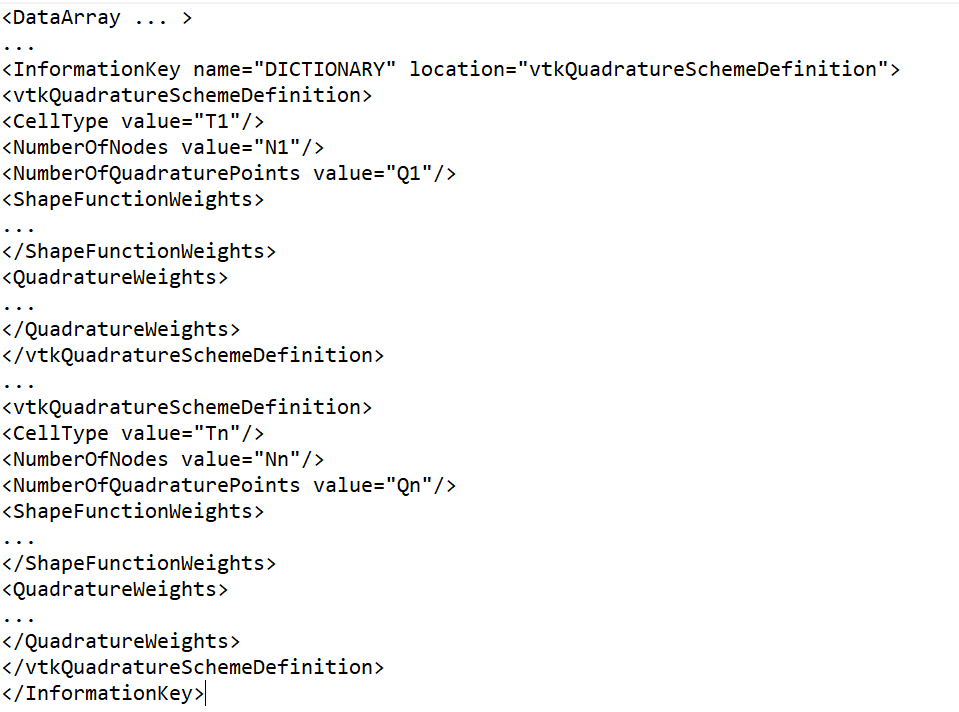
At the end of this document it is possible to see an example of vtu file with the quadrature scheme:

My vtk file has this scheme but I do not if I am giving the values of cells correctly.

Thank you for your attention

Hello Jaume, although it has been a while since you asked the question, I think it might be interesting to record the following solution:
Instead of trying to give the information in the gauss points and let paraview perform an interpolation on the element you could interpolate yourself the stresses and strains from the gauss points to the nodes of the finite element, in this way paraview will perform an interpolation as it does with the displacements that are stored in a nodal form.
However, if one node is shared by more than one element, it will have different stress and strain values, so it is necessary to define the nodes of each element in isolation without sharing them with neighbouring elements. This results in overlapping nodes and considerably increasing the total number of nodes, but it is a simple and effective solution.
Interpolation is quite simple, requiring only one inverse and two matrix products per element.

1 Like

Thanks for your answer. We thought the solucion you propose, but as you say, we have the problem that one node can be shared by several elements. When these elements are coplanar we usually smooth them to have one value for the node. However, if these elements are not coplanar then we have different values in one node. We don’t understand why VTK does not permit write results in gauss points.

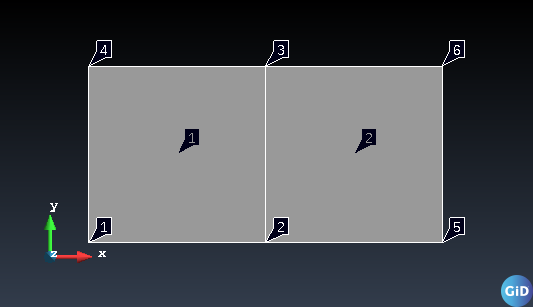
Indeed you may have different stresses or strains in a node but please take a look at the following example of plane stress analysis. I originally have two elements meshed with shared nodes between elements:
image
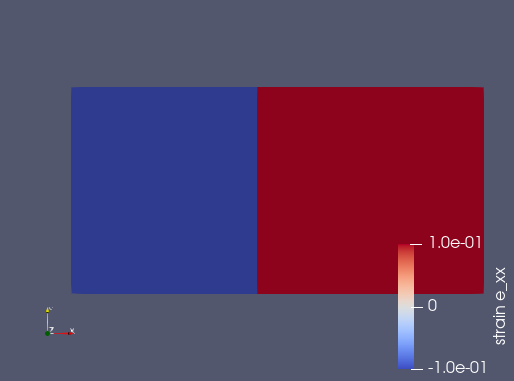
Now I lock the displacements of the two nodes located at the center (2,3) imposing at the same time a positive displacement in X and a zero displacement in Y on all the other nodes (1,4,5,6). Such boundary conditions lead to a negative strain in the left hand side element and a positive strain in the right hand side element.
In order to plot this results I redefine my result model creating a unique set of nodes for each element. Then, interpolating the strains in the gauss to each node, I get the following result (final deformed geometry):
image
Your resulting mesh will have more nodes than the original (8 in this case) but you will be able to plot the corresponding strain-stress state on each element. I guess this is probably what you need, I hope it helps.

1 Like

I have been suffering from exact same problem… The solution proposed by Francesc may be suitable for small meshes, but for complex meshes, it may be problematic.

How difficult it is to implement the results in quadrature points so that ParaView can plot them?

1 Like

I agree with you.

I dig this thread up because I’m facing the same problem: I have 2nd order tetrahedral elements and get four scalar values at the four integration points per element. I would like to visualize this in paraview but I cannot produce a .vtu file that works.

I searched quite a bit to find a working file with the Quadrature Schema inside, however it has only point data: https://www.paraview.org/pipermail/paraview/2013-March/027950.html

I also read through https://vtk.org/Wiki/images/7/78/VTK-Quadrature-Point-Design-Doc.pdf and get the impression that the implementation is not meant to be able to provide values at the integration points, but rather be able to interpolate data from the nodes to the integration points?