I am new to Paraview and I am looking for a simple answer to very simple question: can I change the scale factor or vertical exaggeration of one of the axis in 3D view?
I just loaded my data with XY in range 10-100 (km) and Z in range 2000-50000 (m). I want to keep these units. What I get in 3D view is just a very long needle. I want to change vertical exaggeration factor of Z to 0.0001 and apply it to all the pipline to see sort of isometric view of volume of data.
I already know the Scale in Display settings. It seems OK but the problem is that it applies only to selected (not all) filter and another strange thing is that it rescales the data. I see on the Z axis values of 0.2-50 instead of 2K-50K.
I have to say I am a bit confused with hard time to find this very basic functionalty of any visualisation software. It must be very well hidden in the ParaView
Malol,
Welcome to the ParaView community! You have come to the right place for questions. Note that the Help menu in ParaView also has a lot of resources.
I just used the Transform filter and it seems to me that it has the same effect as the Scale in Display settings. I set 0.5 in the scale of the third axis and all data was rescaled in a Z dimension. I can see it on the values of the “Axes Grid”. I want to keep the coordinates of my data unchanged.
I found similar question on how to scale the axes in the entire render view. The question remains unanswered:
I’m looking to do the same thing to look at a free-surface flow field - think of water flowing down a channel and over a weir. I’m cutting a slice to both see the overall velocity magnitude of the flow and free surface water surface elevation over a very long length compared to the depth of the flow. If I use the transform file to exaggerate the vertical scale, that will give me what I want to better see the change in water surface elevation along this slice and it won’t affect the velocity magnitude where there isn’t much of a vertical velocity component, but just downstream of the weir the velocity magnitude isn’t going to be correct since the transform will affect the vertical component of the velocity, correct?
An option to simply exaggerate the vertical scale would be much more straightforward. It seems like such a universal need that it’s hard to understand why this isn’t available and clearly documented.
Would like to add that I also don’t really want my coordinates to change.
Paraview, please respond to this issue, even if it is only to recognize that the visual exaggeration of an axis isn’t currently possible with Paraview. How does one best advocate for new features in Paraview?
In order to exaggerate Z-axis, you have to go three steps:
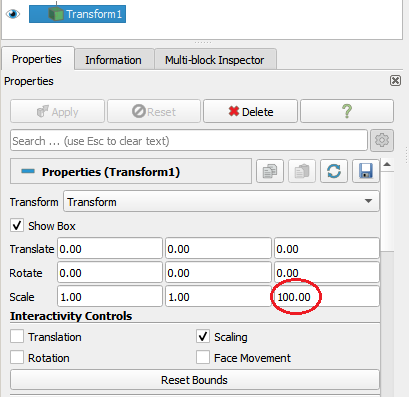
Apply “Transform” filter to your data which you want to exaggerate Z-axis
At the properties panel of Transform filter, you change the scale of Z-axis
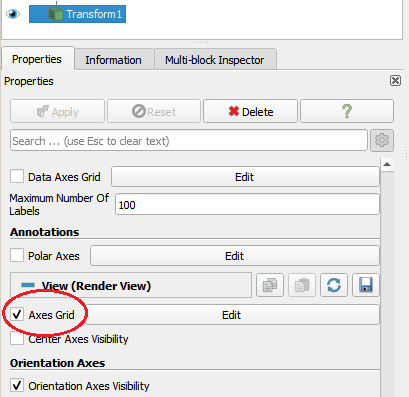
At the same properties panel, go down to Axes Grid, click Edit to open Edit window (note: click Edit at Axes Grid, not Data Axes Grid)
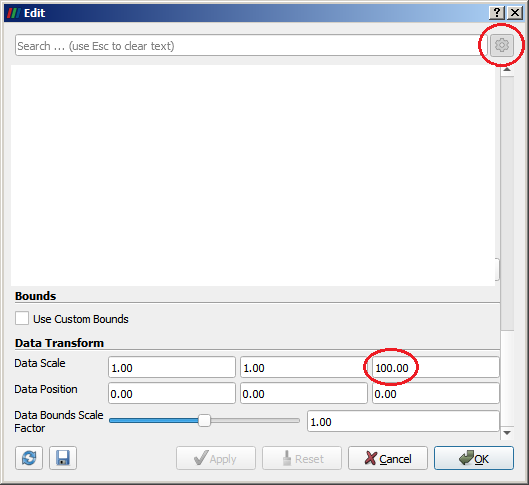
In Edit window, go down to section: Data Transform. At this section, you have to change the scale of Z-axis again with the same value as the value you applied at the second step.
If you do not see the section Data Transform, click the cog wheel at the top right corner, it will appear.
I believe what people are seeking is an easy to use enhancement for vertical exaggeration in Paraview. In other words, a single button on the UI that you can change your vertical exaggeration by X factor FOR ALL DATASETS.
Most are familiar, or at the very least can easily find, that to vertical exaggerate your data you go to the Transform->Scale section in the properties panel FOR EACH DATASET/filter.
However, many people are visualizing many datasets that they all want vertically exaggerated by the SAME amount. If in the course of a day I look at 100 models, I have to manually Transform->Scale each one. This is annoying, since a lot of other 3D visualization software offers this basic functionality.
@cory.quammen@Kenneth_Moreland@mwestphal Thoughts? This sounds like a good idea, but I’m worried about “lying with data” if someone forgets that this feature is set. How about we allow a sticky scale in the X, and/or Y and/or Z direction, with text that can be turned off but defaults on, in a corner saying there is a scale occurring? If we decide to do this, I will support it.
This has come up several times before. There are valid reasons to want to rescale an axis and appropriately update the grid ticks to follow the spacing.
The only reason I can think of not to do it is that the implementation is probably tricky. This is something that has to happen at the rendering level and has to be respected by all types of rendering components (e.g. poly renderers and different volume renderers) as well as rendering systems (e.g. OpenGL, OSPRay, IndeX, etc.).
That said, it is just a simple scaling affine transformation added to the affine transformations already done (I think) by all rendering systems. So, maybe it isn’t as bad as I think.
In order to avoid the misunderstanding of users, I think we should separate two actions:
transform data along an axis (that is Transform filter now). Data values of the filtered axis will be changed.
exaggerate an axis. This filter will change the scale of axis for viewing only. The data values and tick mark values along that axis are not changed (this is a new filter);
For instance, please take a look at this image:
The Transform filter in Paraview can exaggerate the Z-axis like the model in GIF image above.
However, the values of Z-axis in GIF image above are not changed although we apply different Z-scale values.
Meanwhile, the Transform filter of Paraview replaces the original values of Z-axis by Z-values multiplied with the transform factor. Therefore the values on Z-axis are not the original ones and make users confused or even show the wrong scale bar in the legend.
As the comment from @MichaelH , in order to get back the original values for Z-axis, we have to change the transform factor of Axes Grids for each dataset one by one. This process is really time-consuming and tedious.
It is more convenient if we have a new filter, so-called “exaggerate”. This filter can rescale the axis for viewing only (somewhat like zoom in or zoom out along an axis), not change the values.
Ideally, the exaggeration of the Z axis (or other axis) along with the Axes Grids can be applied to all objects/filters/datasets in the pipeline browser.
Having to make a special filter for each object in the pipeline browser is not the right approach from my perspective. In a given day, I have to transform the z scale AND the axis grid for about 100 objects in the pipeline browser. The about of time wasted on doing this tedious and monotonous task is painful.
You can easily make sure the user knows that exaggerations is applied in one of the corners of the 3D viewer with some text; e.g. Z axis : 25 x .
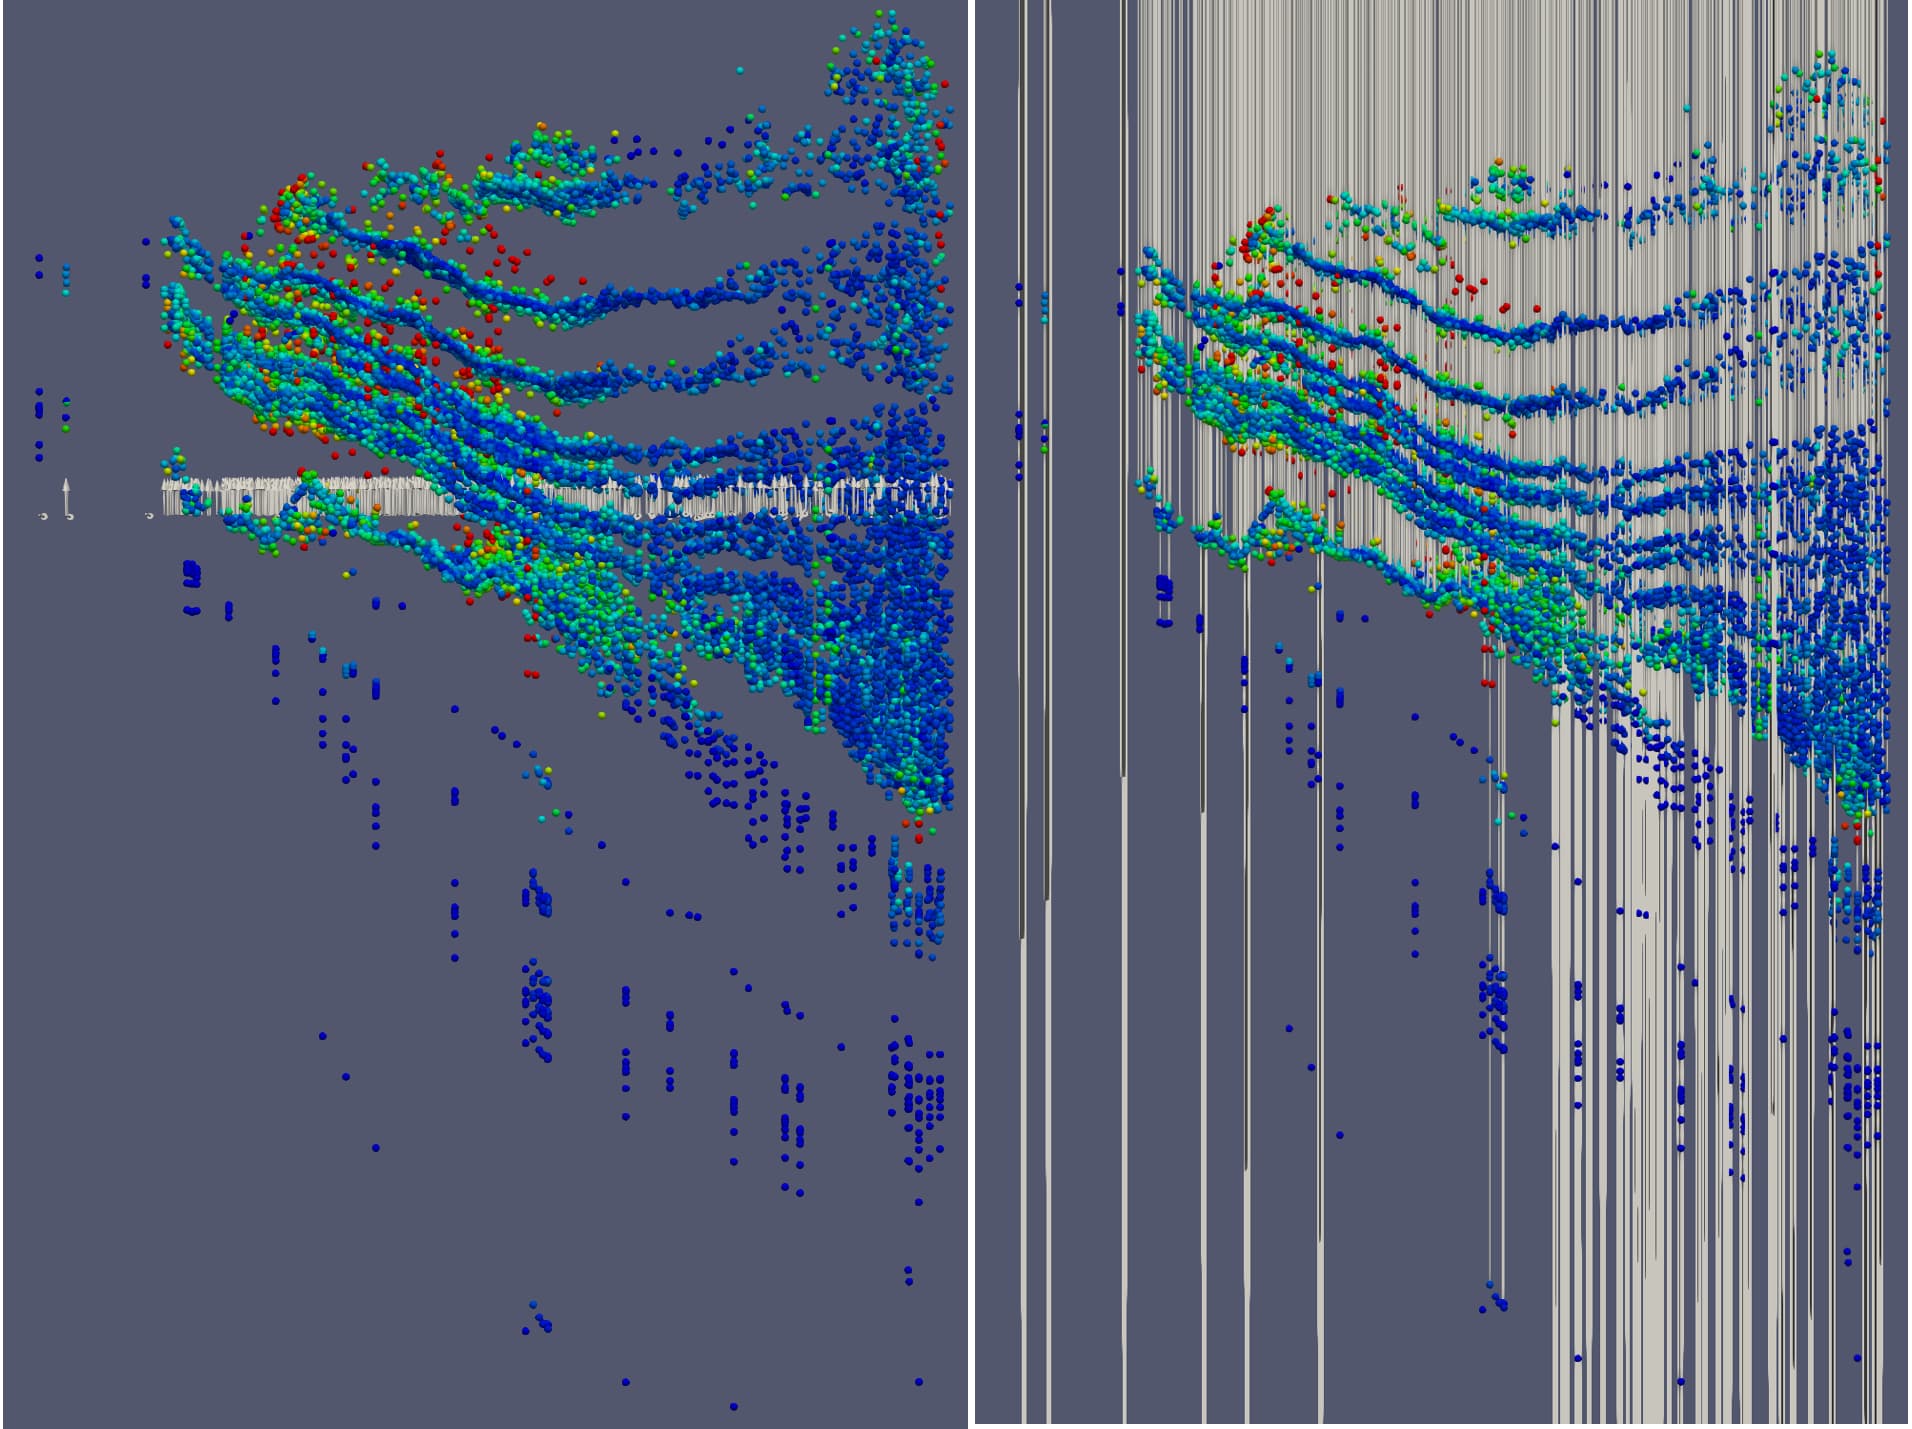
This might be a good opportunity to show an issue the current method for vertical exaggeration on points when there is vector data associated with that. Here is a figure:
On the left are points that are vertically exaggerated (Properties panel → Transforming->Scale) with the arrows being a glyph using the vector data on the points that is NOT vertically exaggerated. On the right is when I applied the same Z Scaling as the points on the glyph filter (using vector data). There is no right amount of scaling the size of the glyph arrows that allows you to properly visualize these vectors.
As described in the git issue above, no. I don’t know of a way to do this currently. I wrote up (and funded) a feature request. See the bug for details.
Thank you for writing this up and funding it! So it looks like this is scheduled for the Spring of 2023. Things get delayed all the time. Is there anything we can do help make sure this happens in the Spring of 2023?
Generally speaking, things don’t get delayed as much as they get prioritized by the folks funding the work. If you have a contract with Kitware, you could also fund the work, and prioritize accordingly. Alternatively, as ParaView is opensource, I’m sure Kitware would not mind if someone volunteered to implement this feature…
As a related issue, the amount of work scheduled for the 5.12 release is probably twice what can be done (real rough guess on my part). Thus, either schedule slips or tasks slip to the fall 5.13 release… 5.11 should drop in the next week. When you figure we will lose the rest of November and December (US Thanksgiving and Christmas/ New Years), there isn’t much time for 5.12…