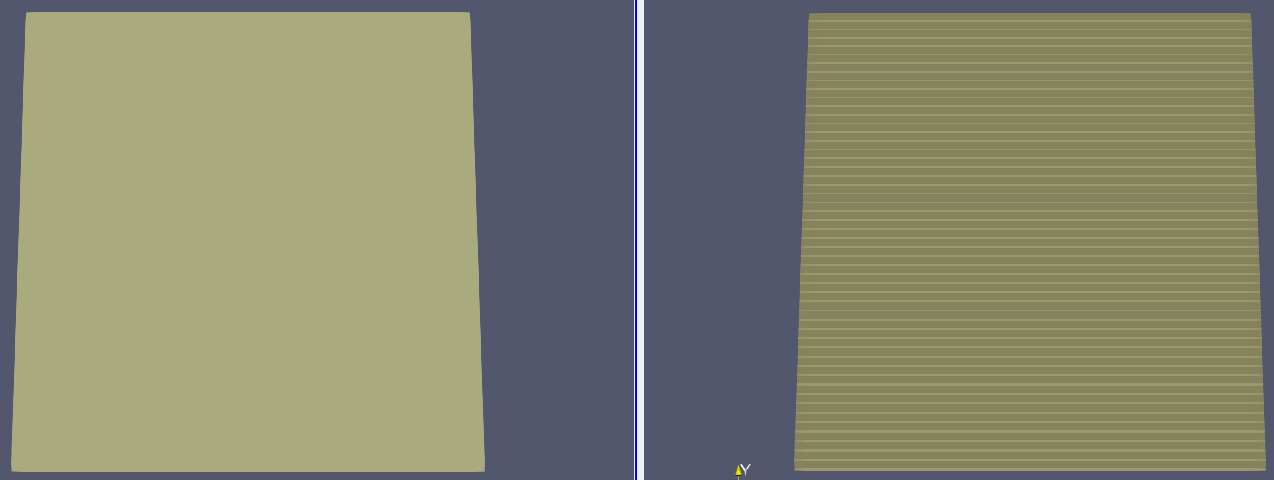
When I apply just the Table to Points filter (no Delaunay3D), there are no creases on the sheared face. So I don’t think it is my data, it’s the way it’s being viewed/processed. Table to Points (left), Table to Structured Grid (right):
Is there yet another way to convert x, y, and z coordinates to a 3D plot? Or is there some way I can automatically convert the .csv to an .xdmf or some other ParaView file? Please help!!!
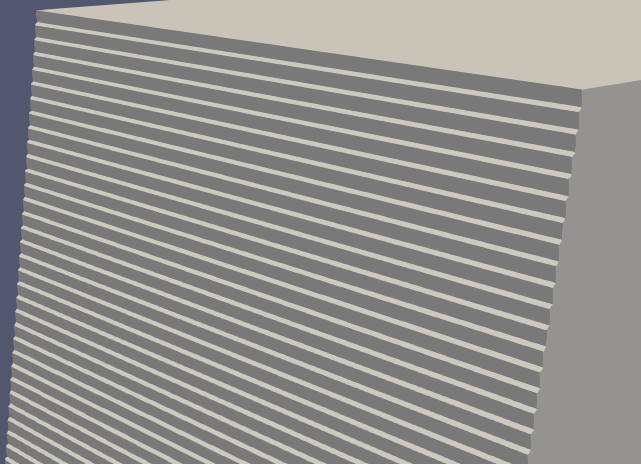
In that case, the “problem” was that these creases actually did exist in the data because the points were close to planar but not exactly planar. The lighting on surfaces make these perturbations of the plane much more noticeable. (Table to Points does not create a surface, so you will not see this effect in that case.)
I suggest selecting 3 adjacent points on this surface that span a crease and check to make sure they like exactly on a line.
If you are absolutely sure that these points are all exactly on a plane, then it would help to post your data. I don’t think we can look any closer without it.
Yes, this is much like that question, which I actually also posted. I was trying to explore to see if there was another possible way/filter to view my data.
When I use Table to Points, I increased the point size in hopes to “create” a surface and see these creases. But you’re saying it wouldn’t even show up no matter how big the points are?
Here is one of the files with x, y, and z data points. I am fairly new to ParaView, so I am not sure how to select 3 points and check that they are on one plane.
And to answer your question, no, changing the point size to see these creases probably will not work. This has to do with how the surface reflects light. The surface provides flat facets that have a distinct normal (a vector perpendicular to the plane). These creases are creating small facets with different orientations. These different orientations reflect light differently, and that makes them very noticeable. In contrast if you draw the points as just a bunch of balls, you won’t get these surfaces at different orientations. All the balls will reflect light pretty much the same, so you won’t be able to see this effect.
I tried sorting the points in Excel (z first, then y, then x), but I got garbage. Because the points are not aligned on the axes, the sorting seems to go wonky.