This is an example of how to customize dynamically your Python View by adding parameters in ParaView linked to your Python View through the use of a custom Python Plugin (adding a Python Filter).
In this example, we will manipulate the number of bins of an histogram from our Python View. You may find the full example with the data below.
python_view_scripting.zip (72.8 KB)
Python Plugin
Creating the Python Filter
What you will want to do to add parameters to your Python View is to first create a Python Plugin that you will load in ParaView to get your custom Python Filter. For this, go ahead and create a new Python file declaring a new filter Python Filter with its base structure.
from paraview.util.vtkAlgorithm import *
from vtkmodules.numpy_interface import dataset_adapter as dsa
from vtkmodules.vtkCommonDataModel import vtkDataSet

@smproxy.filter(name="PythonViewHelperFilter")
@smproperty.input(name="Input")
@smdomain.datatype(dataTypes=["vtkDataSet"], composite_data_supported=False)
class PythonViewHelperFilter(VTKPythonAlgorithmBase):
    def __init__(self):
        super().__init__(nInputPorts=1, nOutputPorts=1, inputType="vtkDataSet", outputType="vtkDataSet")
        self._arrayName = None
        self._arrayValue = 0


    def RequestDataObject(self, request, inInfo, outInfo):
        inData = self.GetInputData(inInfo, 0, 0)
        outData = self.GetOutputData(outInfo, 0)
        assert inData is not None
        if outData is None or (not outData.IsA(inData.GetClassName())):
            outData = inData.NewInstance()
            outInfo.GetInformationObject(0).Set(outData.DATA_OBJECT(), outData)
        return super().RequestDataObject(request, inInfo, outInfo)

    def RequestData(self, request, inInfo, outInfo):
        input = dsa.WrapDataObject(vtkDataSet.GetData(inInfo[0]))
        output = dsa.WrapDataObject(self.GetOutputData(outInfo, 0))

        output.ShallowCopy(input.VTKObject)

        return 1
Here we are declaring a simple filter that takes a vtkDataSet and returns the exact same input. You can see that I added two parameters that we will want to manipulate when applying this filter. But for now, they don’t appear in ParaView.
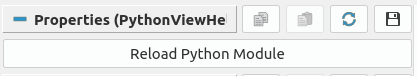
Let’s add the necessary to make them editable from ParaView before to explain their use.
    @smproperty.stringvector(name="ArrayName", default_values="bins")
    def SetArrayName(self, fname):
        if self._arrayName != fname:
            self._arrayName = fname
            self.Modified()


    @smproperty.intvector(name="ArrayValue", default_values=32)
    def SetArrayValue(self, value):
        if self._arrayValue != value:
            self._arrayValue = value
            self.Modified()
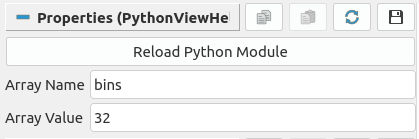
Now, we have two parameters we can modify inside ParaView. The first one is optional, it’s the name of the array we will create to pass our parameters to the Python View. It can be useful to expose it though in order to allow quick modification in the Python View script. The second parameter is the actual value we want to pass to the Python View, in this case the number of bins of an histogram.
The last thing needed to make it work is adding the logic in the RequestData method. Using numpy interface, it’s easy to add tables to the output. Simply add the following before the return.
output.PointData.append(self._arrayValue, self._arrayName)
Using the plugin
To use our freshly created plugin in ParaView, we have to import it. For this, open ParaView and click on Tools / Manage Plugins... on the menu bar. From there, you can Load New... and look for your Python file.
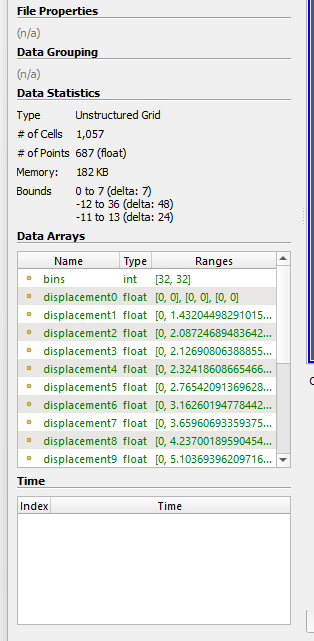
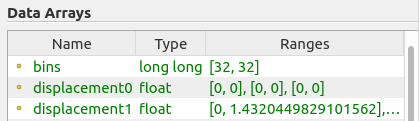
You now have loaded you Python Plugin. You can apply it on your data. Here, I will apply it on the blow.vtk dataset that you can find in ParaView Examples, or in the archive available at the top of the topic. After applying the filter, you should still see your dataset unchanged. Go in the Information panel and see your new Data Array being displayed.
Python View
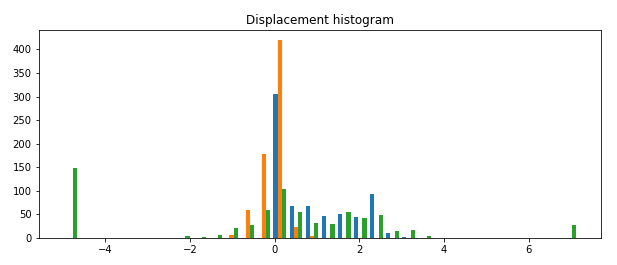
The next step is to create our Python View. After applying your custom filter on your data, you may split the render screen and create a new Python View. Then, you can add your own script to the view. Here is an example of a simple Python View displaying an histogram of the displacement6 data array available on the given dataset.
from paraview import python_view
import paraview.vtk.util.numpy_support as ns
from vtkmodules.numpy_interface import dataset_adapter as dsa
from vtkmodules.vtkCommonDataModel import vtkDataSet

def setup_data(view):
  for i in range(view.GetNumberOfVisibleDataObjects()):
    view.DisableAllAttributeArrays()
    view.SetAttributeArrayStatus(i, dsa.ArrayAssociation.POINT, "displacement6", 1)


def render(view, width, height):
  figure = python_view.matplotlib_figure(width, height)
  figure.set_facecolor('white')

  plot = figure.add_subplot(2,1,1)
  plot.set_title('Displacement histogram')

  for i in range(view.GetNumberOfVisibleDataObjects()):
    dataObject = view.GetVisibleDataObjectForRendering(i)

    if not isinstance(dataObject, vtkDataSet):
      continue

    disp = dataObject.GetPointData().GetArray("displacement6")
    npDisp = ns.vtk_to_numpy(disp)

    nbBins = 32
    plot.hist(npDisp, bins=nbBins)

  vtk_image = python_view.figure_to_image(figure)
  return vtk_image
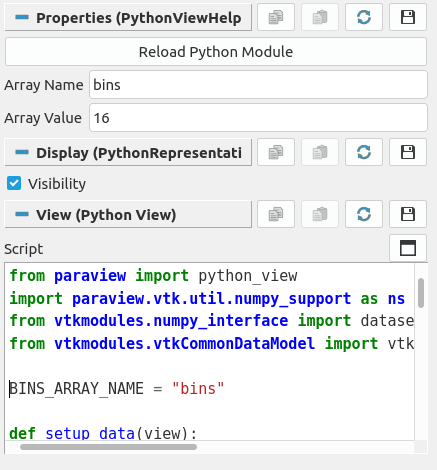
At this point, your Python View should look like this.
An optional thing you can do for quick modifications and a better legibility is to declare at the top of your script a variable that will keep the name of your array. This will avoid repeating your array’s name in the script. Here I declare the name of the array right after the imports to be able to see it easily in the script text area.
BINS_ARRAY_NAME = "bins"
At this point, you should be able to make match names easily.
Lastly, we will make use of this variable and allows passing our data array to the Python View. First, setup your array in the setup_data method in the loop.
view.SetAttributeArrayStatus(i, dsa.ArrayAssociation.POINT, BINS_ARRAY_NAME, 1)
And then, you can retrieve your information in the variable storing the number of bins.
    bins = dataObject.GetPointData().GetArray(BINS_ARRAY_NAME)
    if bins is not None:
      nbBins = bins.GetValue(0)
Congratulations! You just customized your Python View with a simple Python Plugin =)
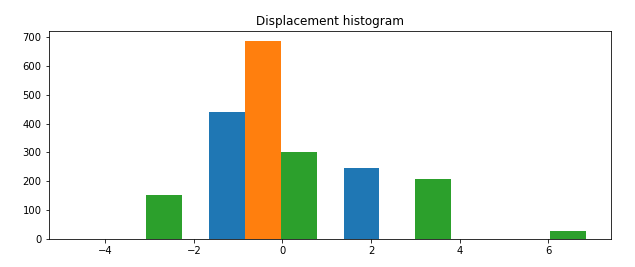
You can now change the value in your filter and the change should appear in your Python View when you apply it. Try setting the number of bins to 4 and here is what you should see.
Do not hesitate to download the archive to get the full code explained here. It comes with comments to guide you.