Thanks for the data. I managed to download it and open it up in ParaView with a colleague.
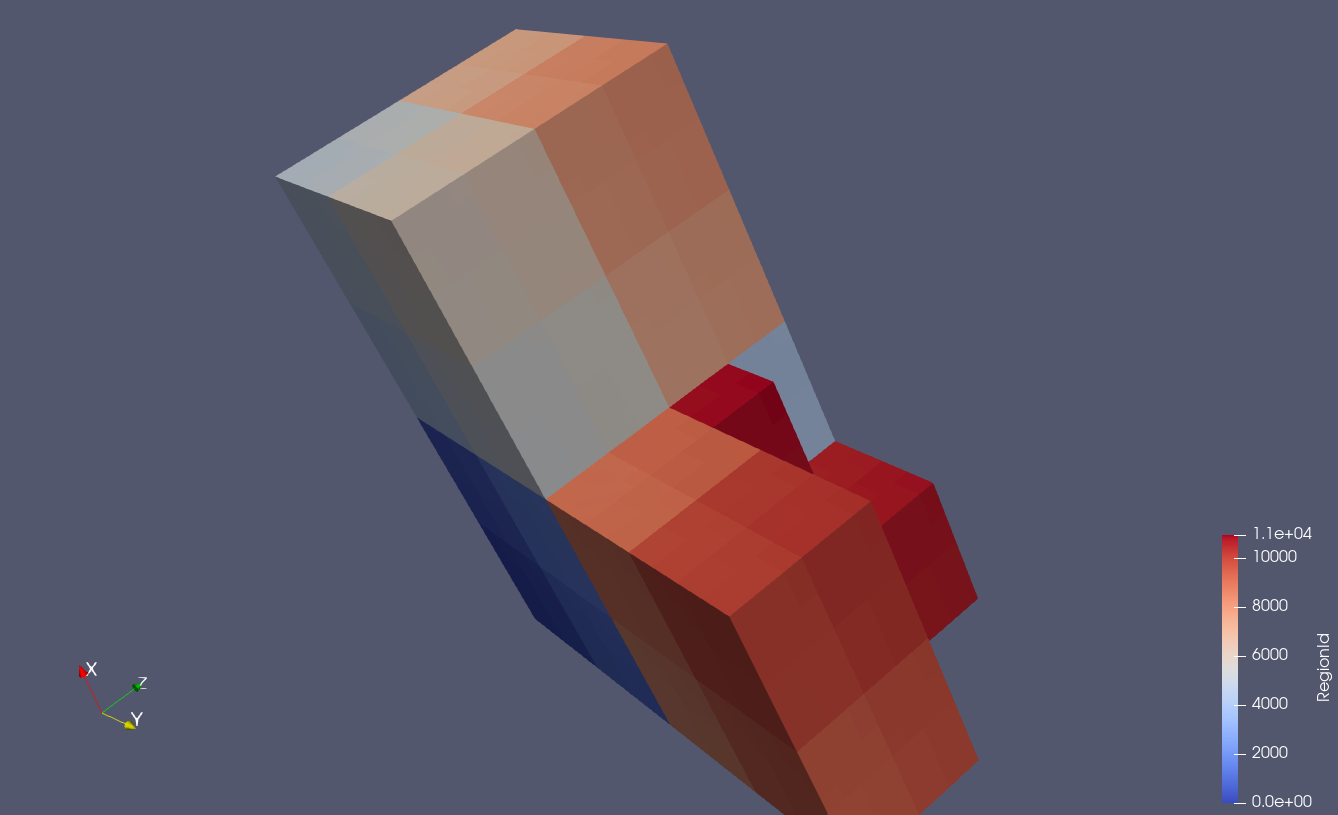
I do believe there is an issue with the data however, It seems like you’re data is somehow segmented in every file. The “Connectivity” filter calculates the mesh connectivity of a data set (i.e. which domains are path connected) and it outputs this image when run on solution-00.000.vtu of your dataset:
It finds a multiply connected domain when it should be one whole mesh. This is most likely why the filters are not working properly.
You’re data also looks like it is very well structured and might not need the flexibility (and heavy memory constraint) of an unstructured grid. My advice to you would be to do some pre-processing of your data to turn it into a monolithic image data (sample.vti). You can find documentation on file formats here: https://kitware.github.io/vtk-examples/site/VTKFileFormats/.
Once you have this file, running the contour filter on your “GrainId” field on a range of values (each value in between one GrainId and the next) you should be able to visualize your grain boundaries.
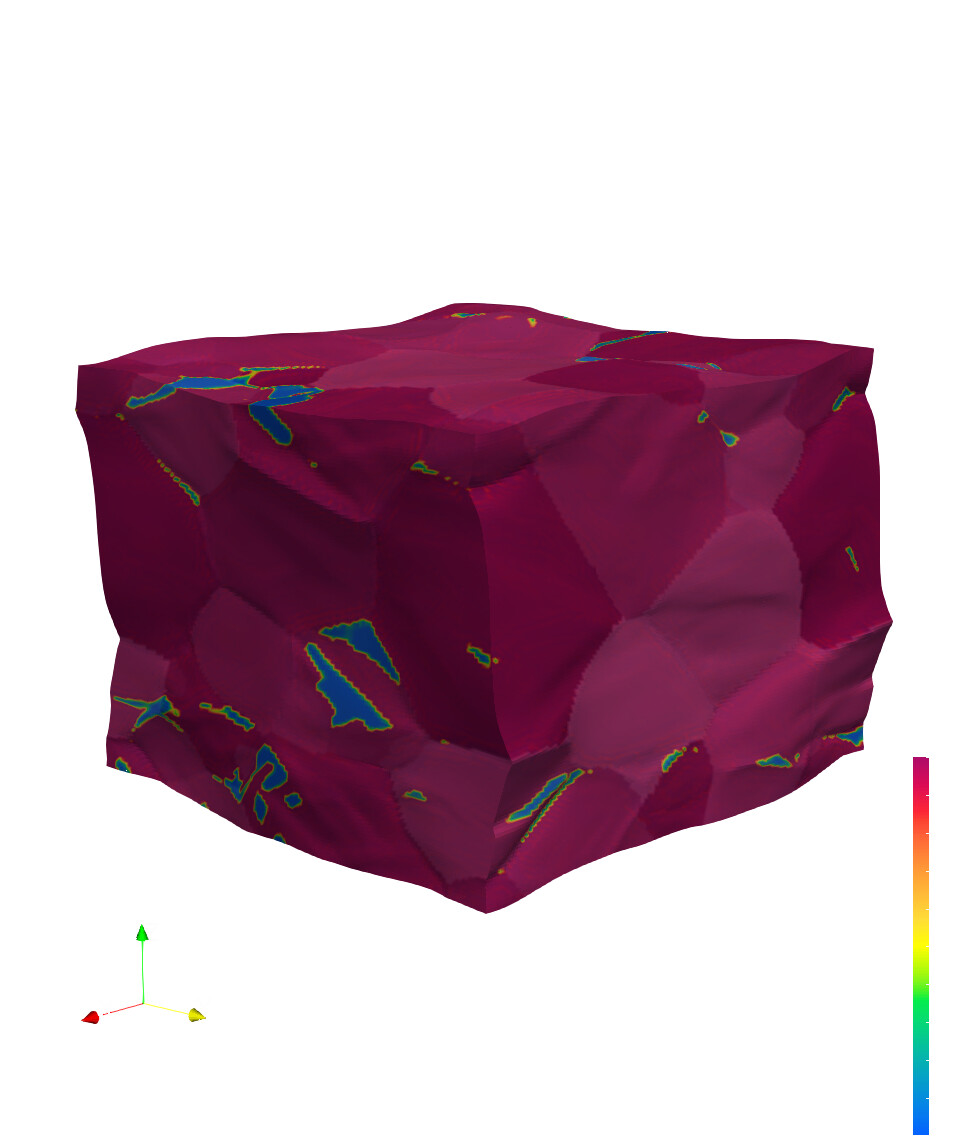
Thank you for your detailed response. I use deal.ii and generate *pvtu/*vtu files from that. I don’t think I can shift to an structured grid as in some time steps I will have huge distortions. Below is the initial grid:
Is there no way of applying contour filters on the *pvtu file? I use large number of processes and view these files using paraview from a remote cluster. Merging them into a single file makes it too cumbersome to work with.
Also, I tired using merge blocks filter as mentioned here, but the filter is unavailable.
So the Contour filter should work automatically with any valid vtu/pvtu file that you load in. I believe the issue is in the file itself, more precisely, the description of the mesh.
Is this a Discontinuous Galerkin simulation by chance?
It would seem that the output of the connectivity filter generates as many regions as there are cells. This should mean that none of the cells are actually connected in the file which leads me to believe that there is an issue in the mesh description. This is most likely why most filters are failing.
If the files are directly from deal.II, this might be an issue to bring up with them and there could be a bug in their vtu/pvtu writer.
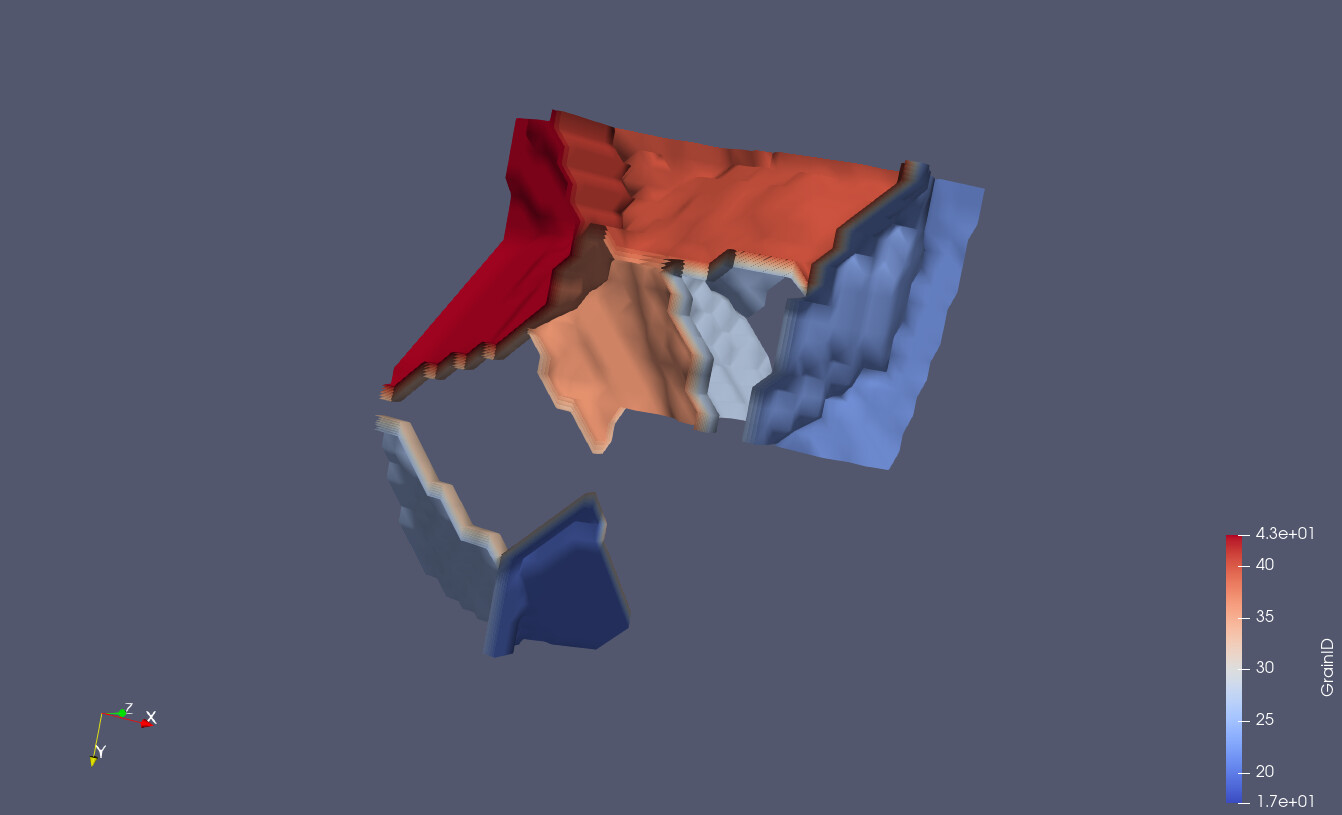
In any case, using the “CleanToGrid” filter in paraview (which can deal with this type of problem), I managed to visualize the output of contours on a valid mesh. This cleantogrid.pvsm (649.1 KB) is a state file that you can load into ParaView. And here is an image: