Hello, sir. I am new to Paraview. I also want to get the position of the particle from .vtp file. I have read your answer but I don’t find the RessampleWithDataset. Could you tell me the steps in more detail?
Unclear, please clarify what you want to do.
ResampleWithDataSet can be found in Filters->Alphabetical
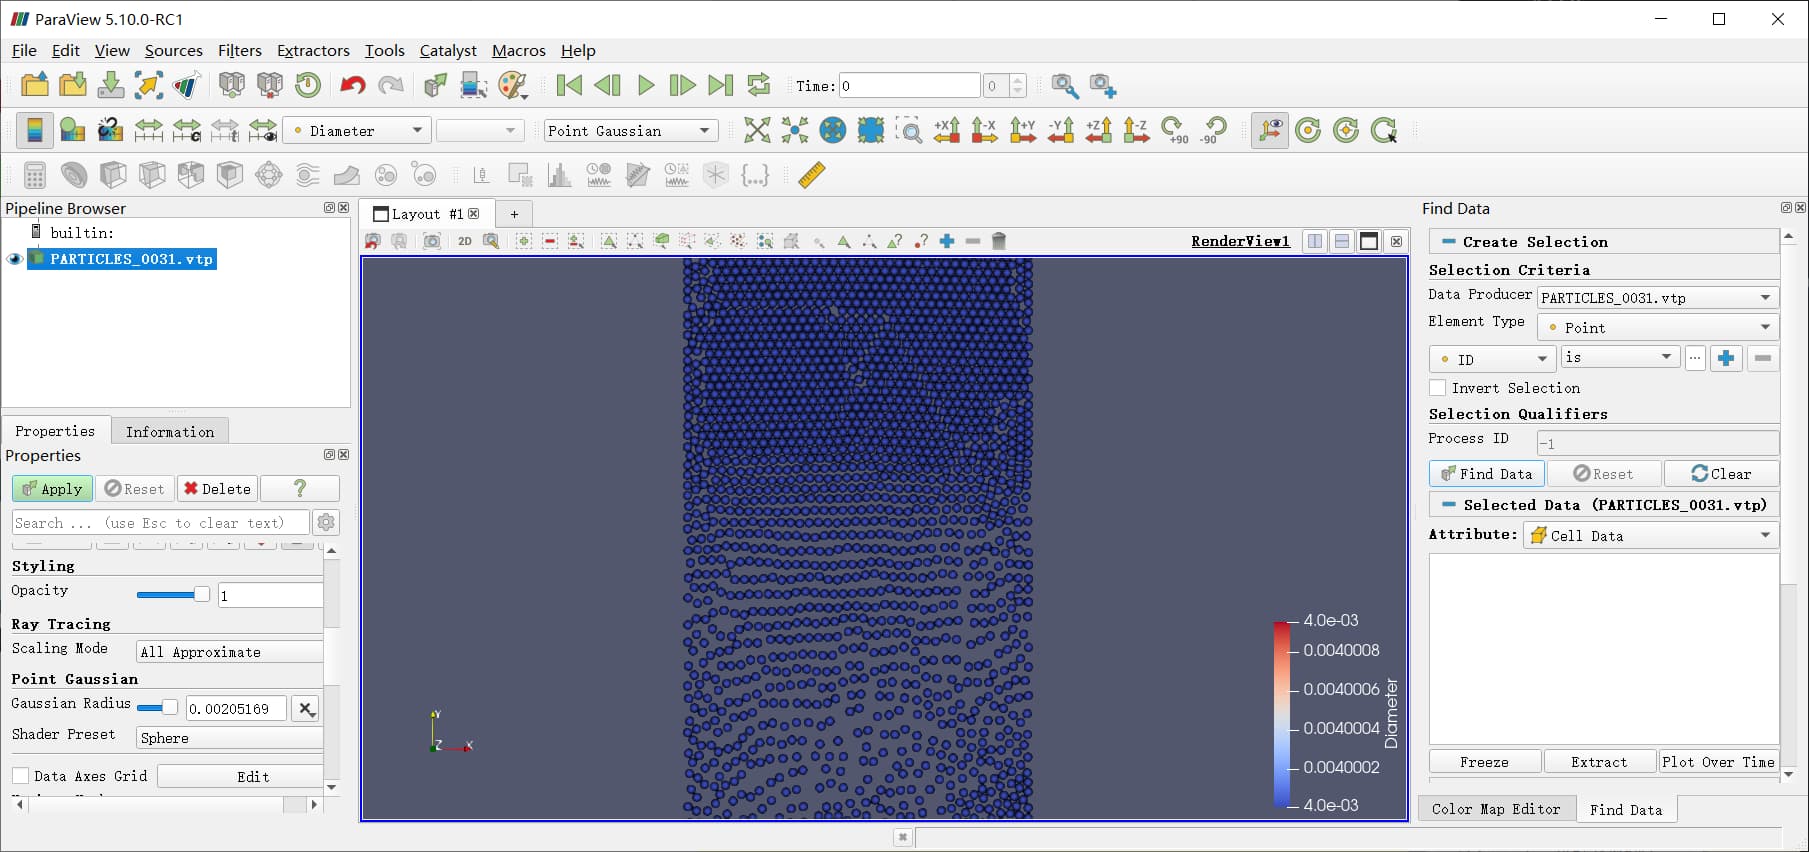
And when I open Filters->Alphabetical, these options are greyed out and cannot be clicked on, what is going on?
Press Apply
please share your data
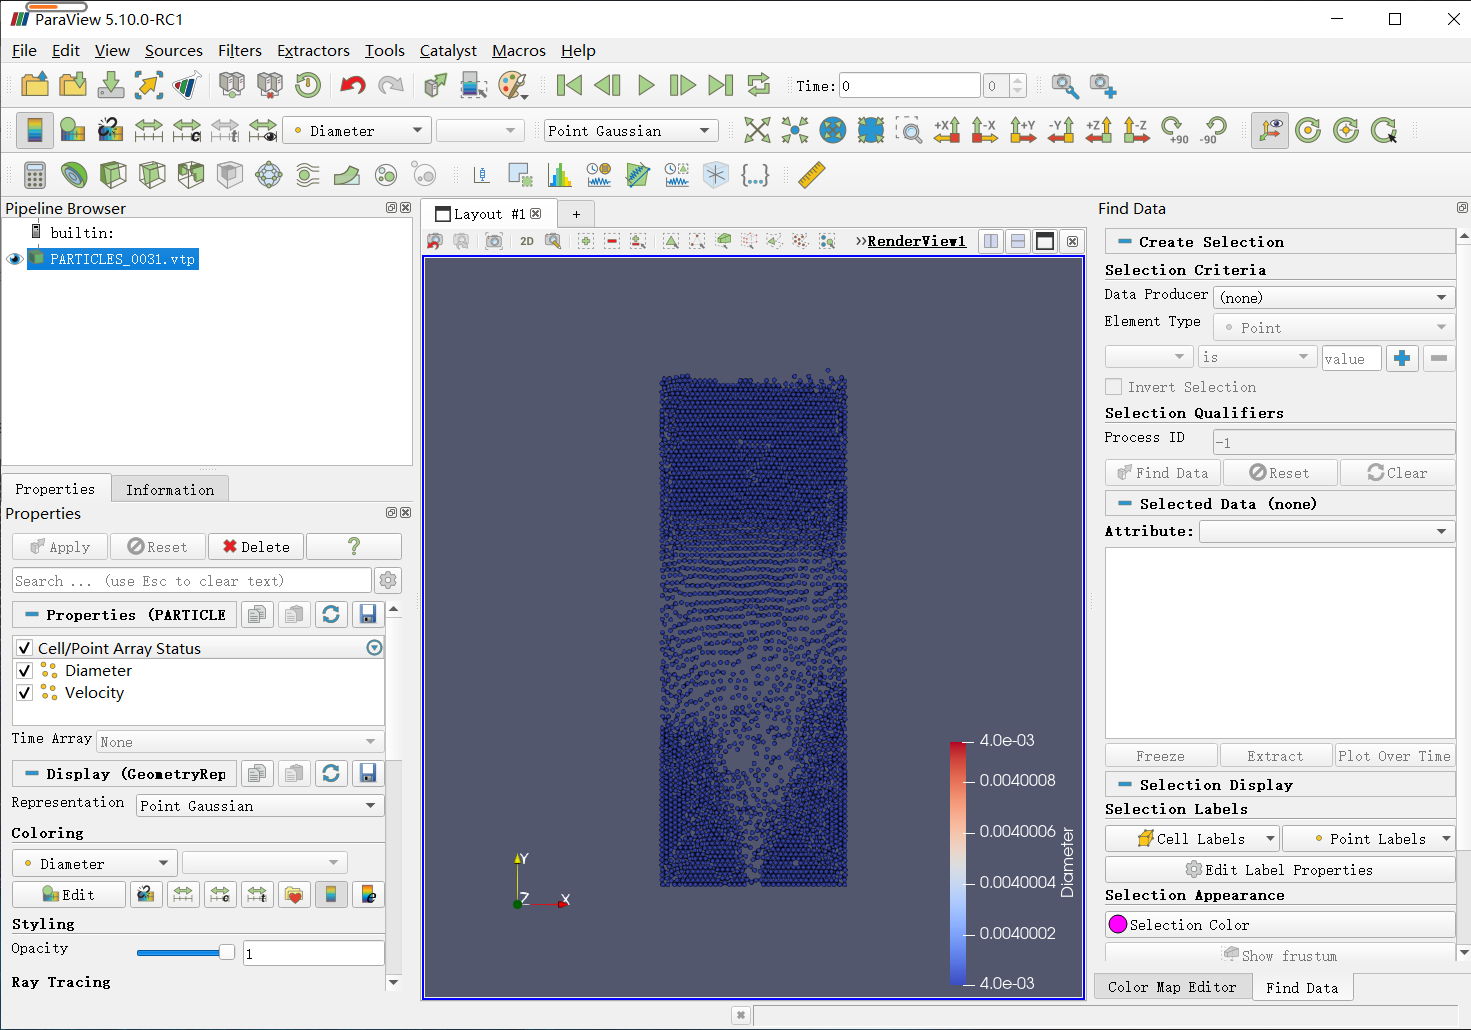
It is my data
PARTICLES_0031.vtp (136.3 KB)
No problem here. You probably add a faulty python calculator in your pipeline.
Thank you. but I didn’t change the default conditions, nor did I add Python calculator, nor did I find an explanation of how to do this in the user manual. Could you give me more details on how I can change it to see or get the coordinate position of the particles? Thank you very much.
I am also pretty confused by what you are asking. When you say you want to “get the position of the particle,” do you mean you want to get the numeric values of the X,Y,Z position? And which particle is “the” particle?
There are a couple of ways to get X,Y,Z position. One is to open the spreadsheet view. Press one of the split window buttons in the upper right of the view ![]() , and in the new view select
, and in the new view select SpreadSheet View (the bottom button). That will give you the coordinates of all the points.
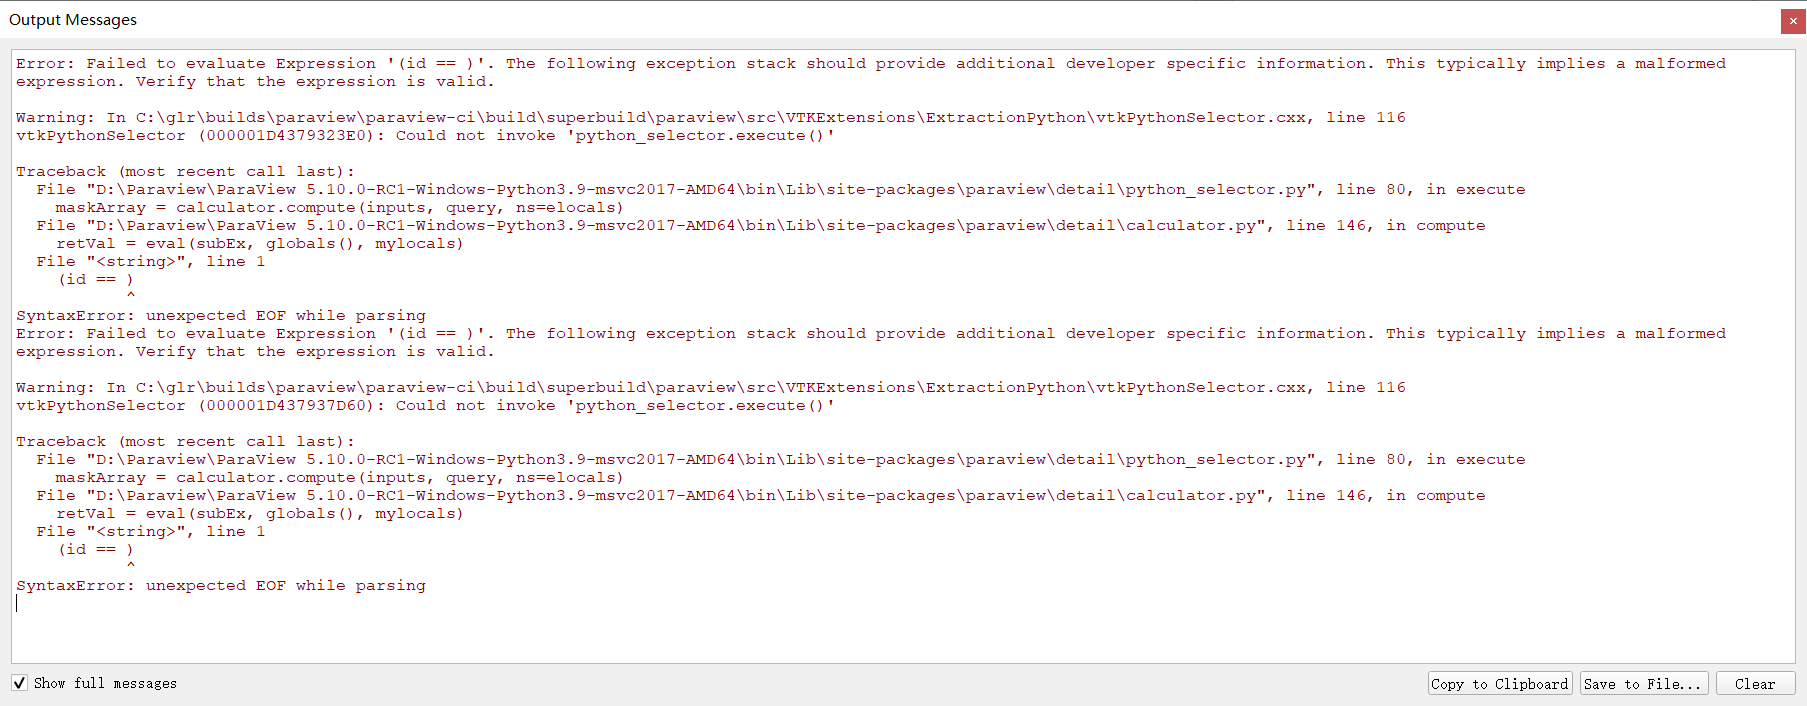
The errors you posted look to me like an issue with the Find Data dialog box. (Are you using that?) Specifically, it looks like you are look for a point or cell of a specific ID (good idea), but didn’t put in a number for the ID. You can use the Find Data dialog box to pull information from a single point if you want by changing the upper left box to Point(s), the next row to say that the ID is some number (e.g. 0). Then Run SelectionQuery. To see the coordinates of the point, change the Show: parameter over the spreadsheet to Point(s).

Thank you very much, I just want to get the XYZ coordinates of the points, because I am simulating particles, so I just say particles, but actually points. I am sorry about my inaccurate word. According to the way you said, I can see the coordinates of the points, but there is still a problem, how to output the coordinates of these points, direct copy seems to be unable to separate the data by column.
You could try playing with copy/paste (ctrl-c/ctrl-p) in the Find Data and SpreadSheet View. They work a little weird on my Mac, but they work.
Alternatively, you can just save the data as a csv file. File → Save Data and then just select Comma or Tab Delimited Files (*.csv *tsv *.txt) as the file type.
Thank you very much!
File → SaveData → file.csv