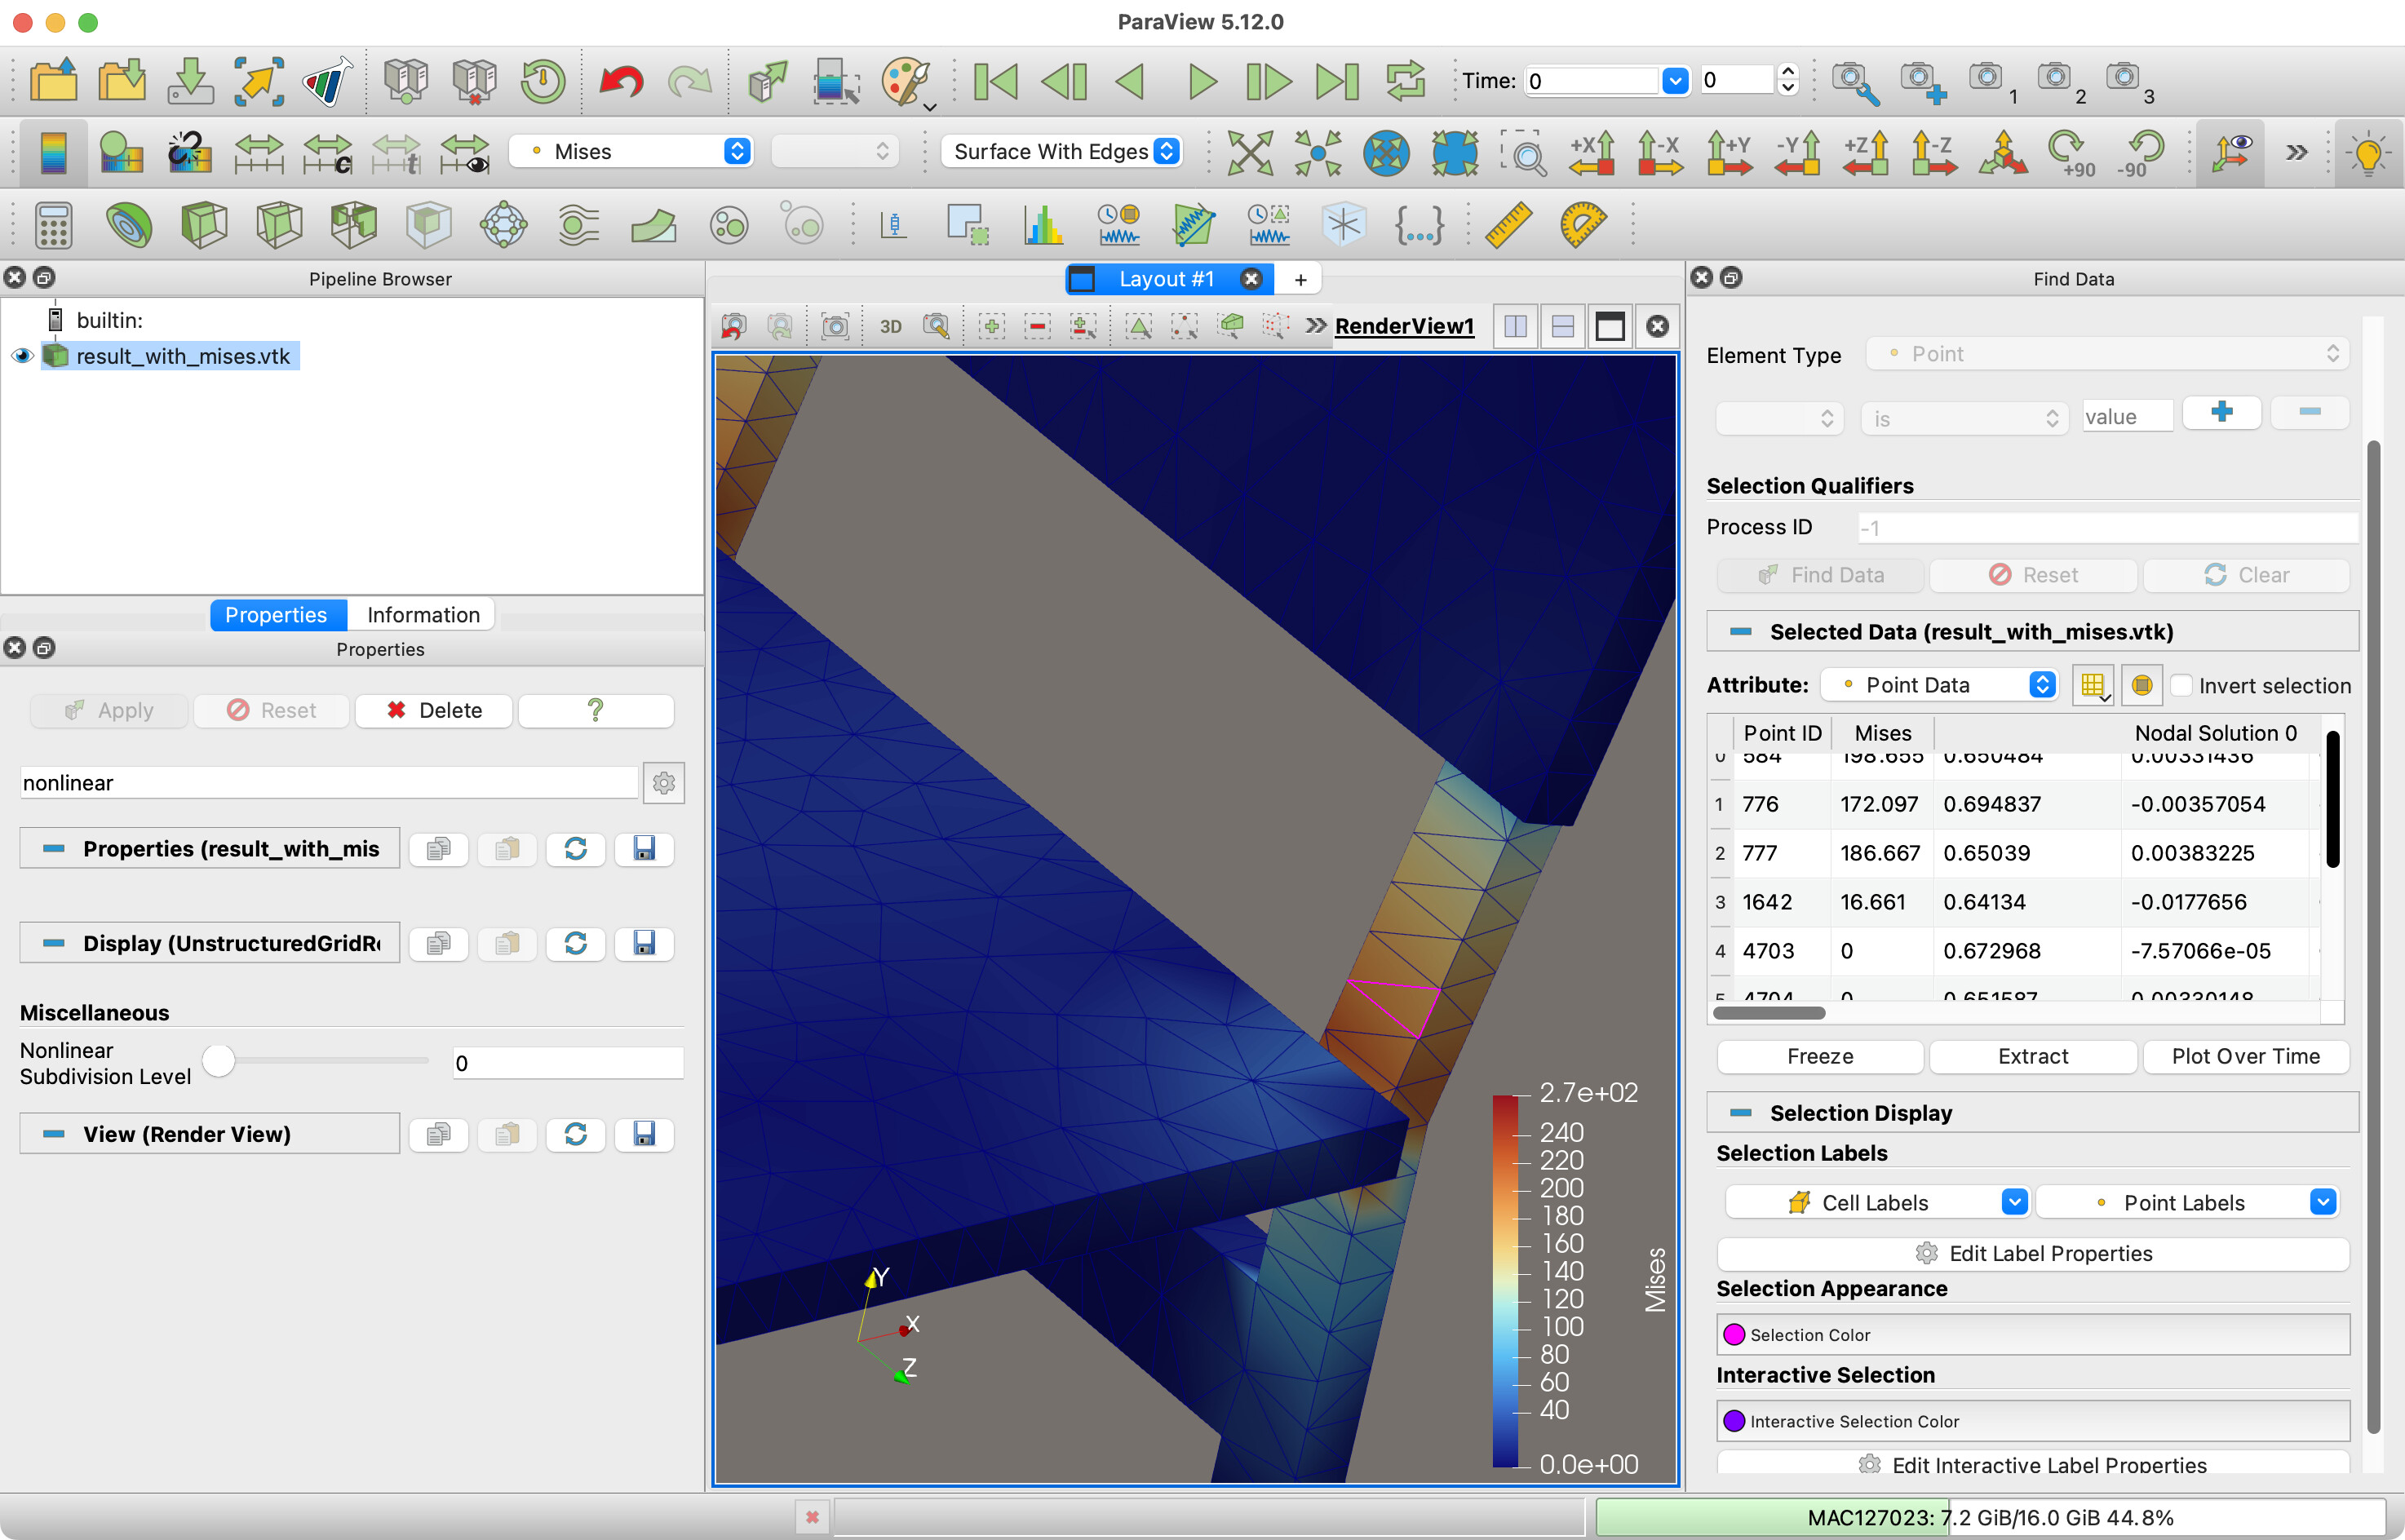
A quick summary: your data has quadratic elements. The tetrahedra have 10 values: 4 for each vertex and 6 for each edge. Some of your fields (e.g., Nodal Solution 0) have values for all 10 control points. However, other fields (e.g., Mises) only have values for the 4 vertices. The values for the edges are set to 0, which messes up the quadratic interpolation in the cell. The easiest solution is to set the Nonlinear Subdivision Level display parameter to 0.
Thanks too much for solution abount set the Nonlinear Subdivision Level display paramter to 0. It worked on my paraview5.12 windows as well.
Is there any way that could save the option about Nonlinear Subdivision Level to 0 and save it to vtk file? So that when I open the new vtk file, the Mises default option abount Nonlinear Subdivision Level is 0. It would be better if this function could be implemented using pvpython script。