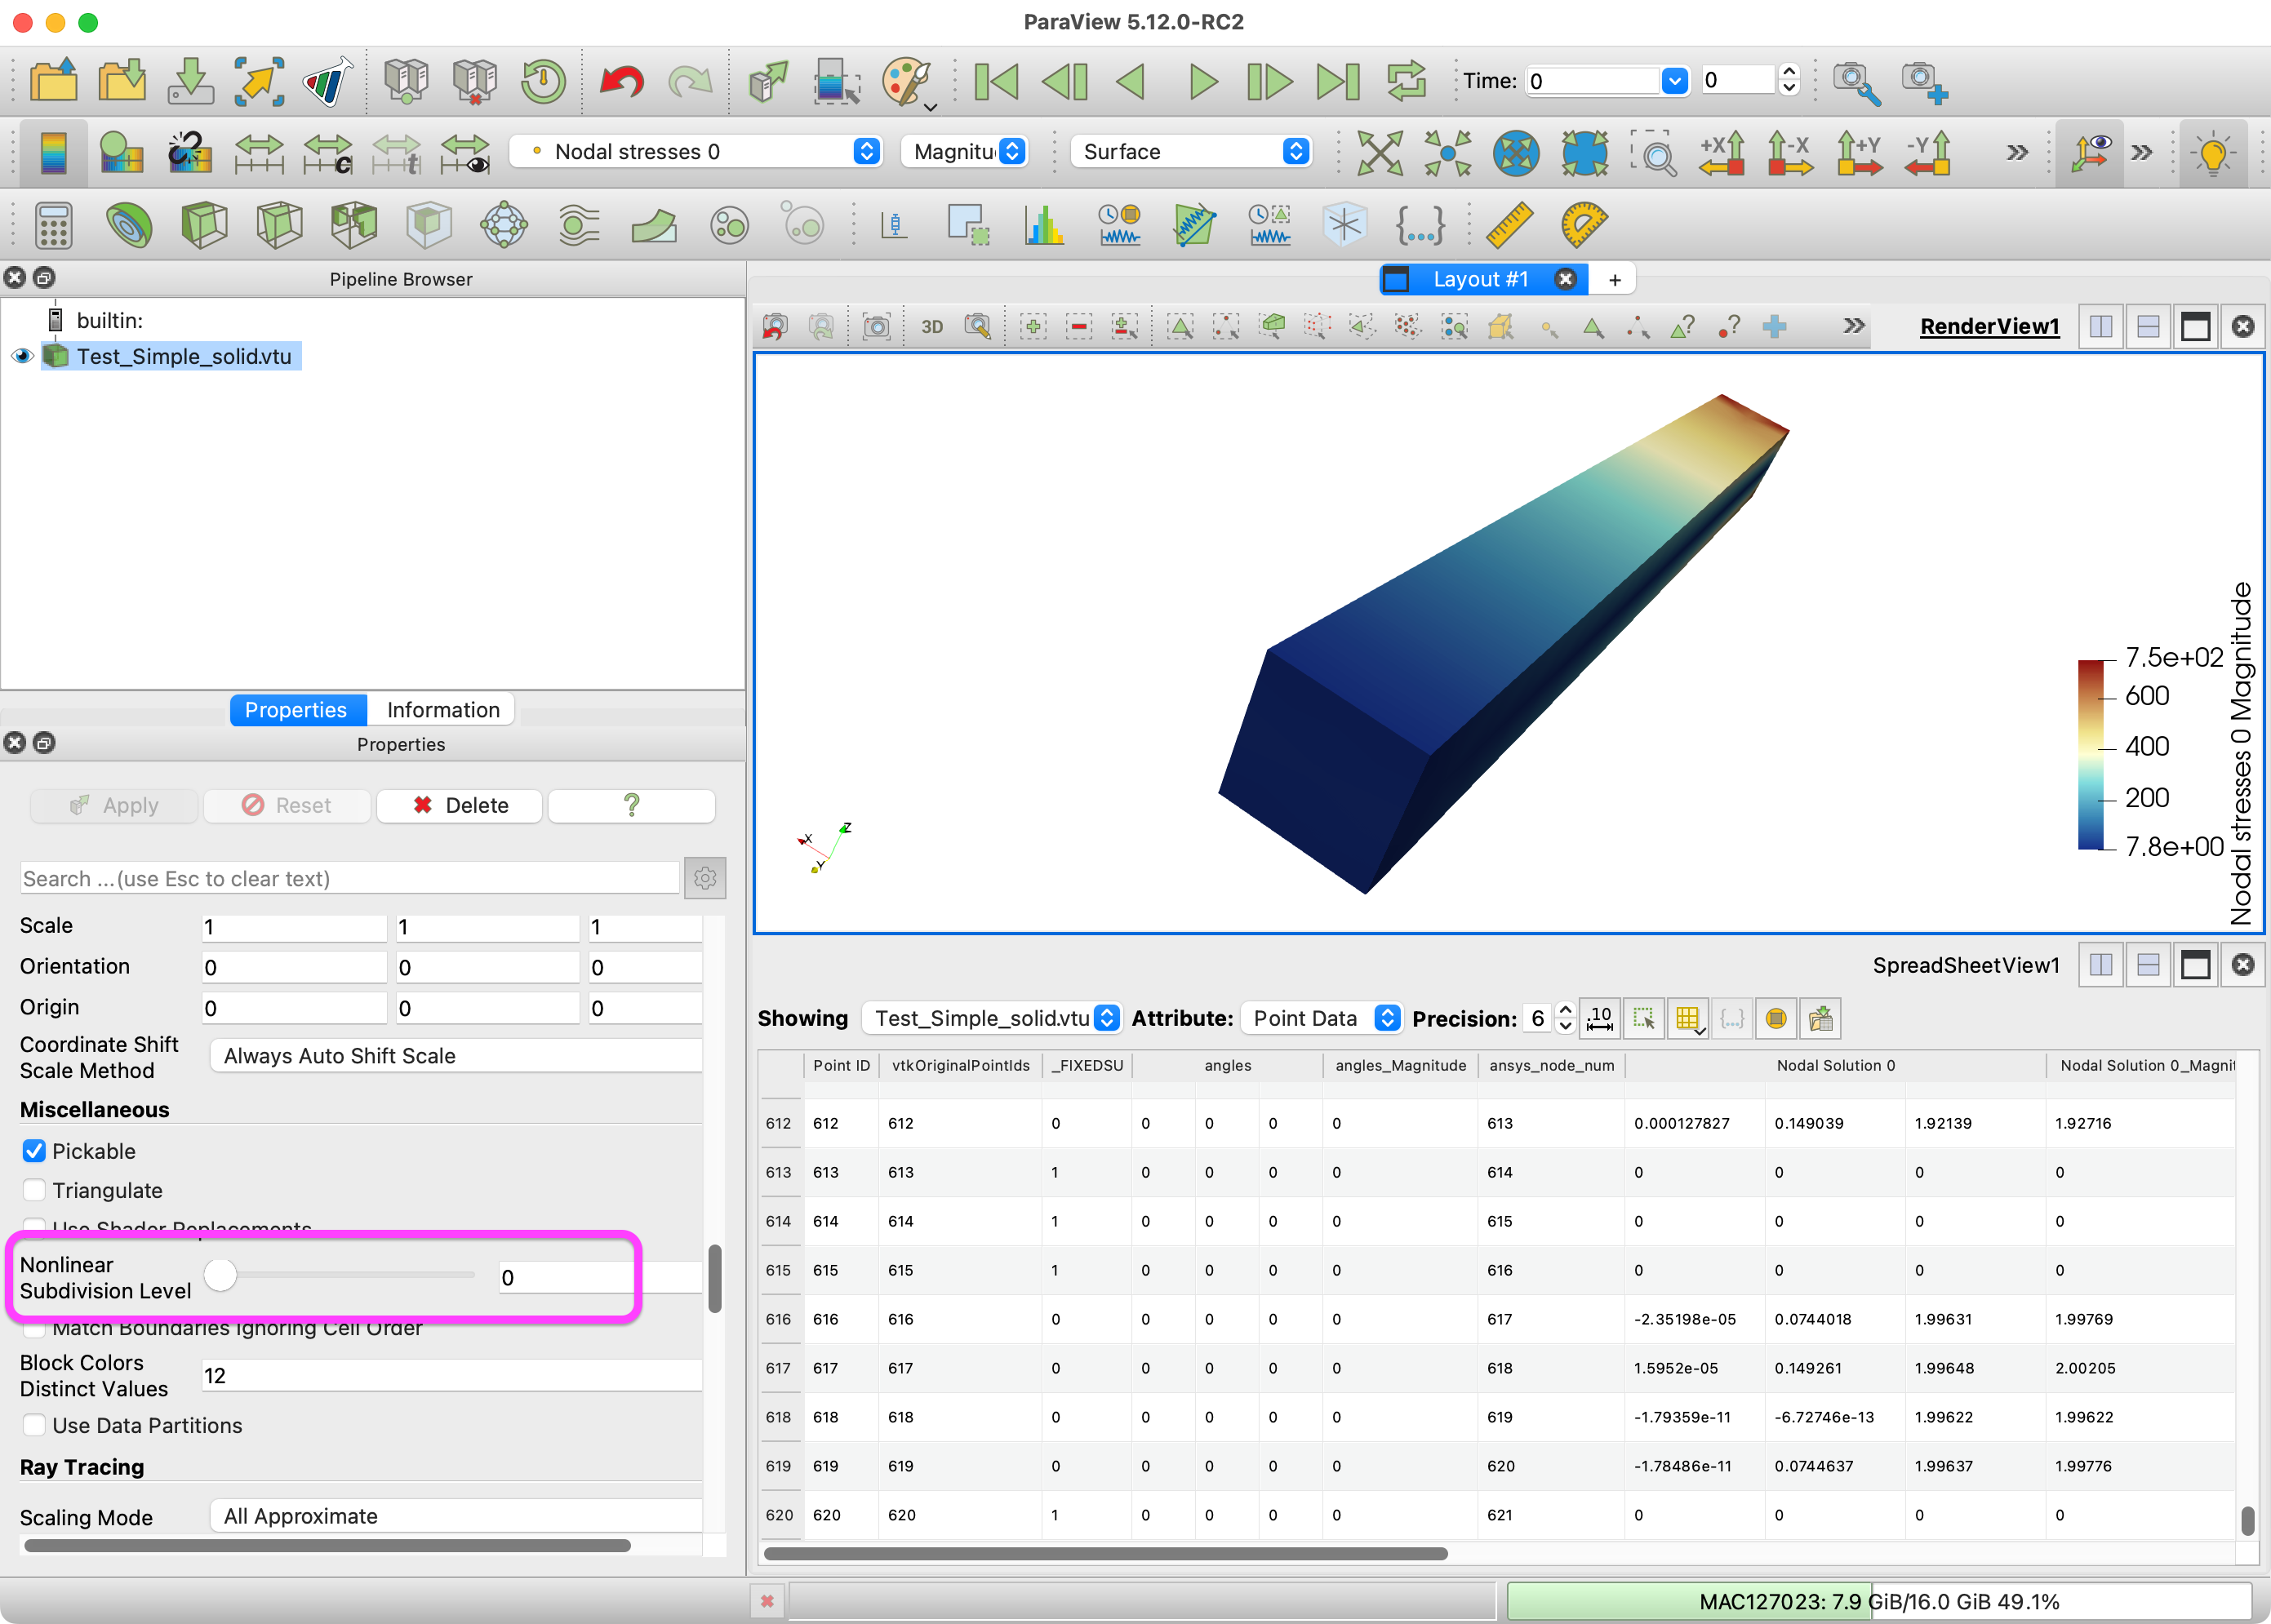
I believe the problem is that, well, you have NaNs in your data. If you open up a Spreadsheet view showing point data and scroll to the bottom, you will see many points have NaN values for Nodal stresses 0.
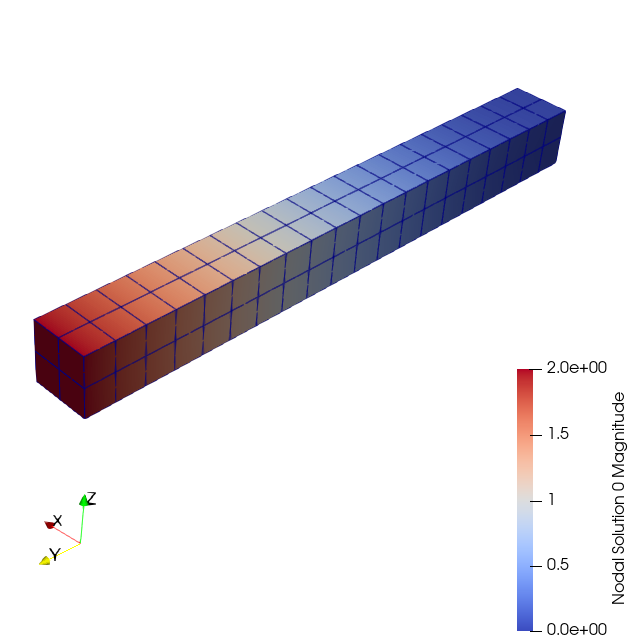
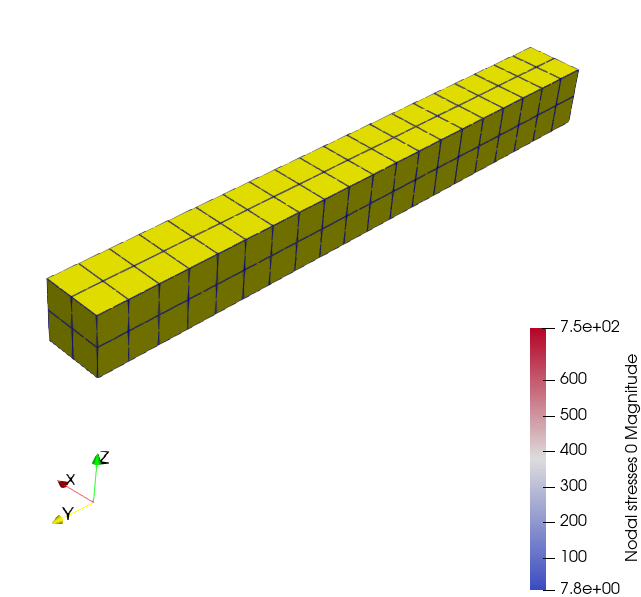
I think what is particularly confusing about your data is that your cells are quadratic hexahedra. They are defined by 20 points instead of just the 8 corners for a linear hexahedron. Although all 20 points have field data for many fields such as Nodal Solution 0, the Nodal stresses 0 only has values for the first 8 points, and the rest are set to NaN.
What I suspect is happening is that the code generating this data is doing quadratic interpolation for fields like Nodal Solution 0 but only linear interpolation for Nodal stresses 0. Having no values for the extra coefficients, it writes NaN for those.
Although writing NaNs is fairly reasonable, ParaView doesn’t consider this possibility. It tries to do a quadratic interpolation, the NaNs cause the coefficients to be NaN, and that in turn causes everything to report as NaN. It would be better if instead of NaNs, the code generated values for these extra 12 points that simply represent the linear interpolation.
Barring that fix, there is an easy way around in ParaView. One of the advanced Display properties is Nonlinear Subdivision Level. When ParaView renders quadratic elements, it estimates them by subdividing them and using linear elements as approximations. This option specifies how many subdivisions to do. By default, Nonlinear Subdivision Level is set to 1, meaning each surface quadratic quad is subdivided one time (into 4 linear quads). If you lower Nonlinear Subdivision Level to 0, nothing will be subdivided, and the surface will be represented only by the linear coefficients, which are all real values in your data.
Many thanks for the super detailed explanation. This makes total sense as the nodes are actually connected with a quadratic shape function. The reason for this is simply due to the p-approach of the FE model that was used.