Dear all
I would like to generate streamline with my CFD result
However, I can’t apply ‘Streamline Tracer fileter’
Does anyone can help me this kinds of problem?
I saved my data to csv file format
Dear all
I would like to generate streamline with my CFD result
However, I can’t apply ‘Streamline Tracer fileter’
Does anyone can help me this kinds of problem?
I saved my data to csv file format
A CSV file, which is more typically used for spreadsheet applications, just describes a table of information. No more, no less. And that is all ParaView knows about your data, that it is a table of numbers. ParaView can’t tell the difference of a CSV file from your CFD simulation or your tax returns, so you will have to tell it what it means.
At this point it would help if you provided some information about your CSV file, such as what columns exist, and maybe even provide a sample file. Presumably, every row in your CSV file represents a point in space, and your CSV file has at least 6 columns: the X, Y, and Z locations of each point as well as the V_x, V_y, and V_z of the velocity vectors.
To convert this table to a spatial structure that ParaView understands, you have to use either Table To Structured Grid or Table To Points. If you CSV file describes points in a 2D or 3D array of known dimensions, you can use Table To Structured Grid to get a volume. But, it is more common to have to use Table To Points. In either case, you will select which columns of your table represent the X, Y, and Z positions of the points, respectively.
If you are using Table To Points, you won’t actually get a volume. You will just get a set of discrete points in space with the rest of space being empty. ParaView cannot do streamline tracing on this type of data. You will have to fill the volume. You can convert this point cloud to a full volume using either Point Volume Interpolator or Delaunay 3D.
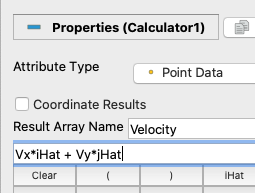
Finally, ParaView’s stream tracer needs a vector field. Unfortunately, each column in a CSV file can hold just one number, essentially a scalar. So your CSV data does not have one field of vectors, it has 3 fields representing each column. You will have to combine those 3 scalar fields into one vector field. That can be done with the Calculator filter. Just create an expression that multiplies the X, Y, and Z fields by iHat, jHat, and kHat, respectively. These special values represent the unit vectors for the 3 axes. The calculator expression will look something like this
Vx*iHat + Vy*jHat + Vz*kHat
Of course, replace Vx, Vy, and Vz with the column names used in your CSV file.
After that, you should be able to create a streamline.
Thank you very much for your help.
I’m so sorry that I followed your suggestion exception of finally part.
What do you mean of iHat and jHat?
(Actually, mine is 2D case)
I mean when you create the Calculator filter, there is a textedit box in which you type in an expression to evaluate for each point (or cell) in your mesh. Use the strings iHat and jHat to represent the vectors [1, 0, 0] and [0, 1, 0].

Thank you so much for your help.
I finally find it! It was really helpful for me. If I have another problem, I will aks you once again !! Thank you very much
A post was split to a new topic: Help with calculator