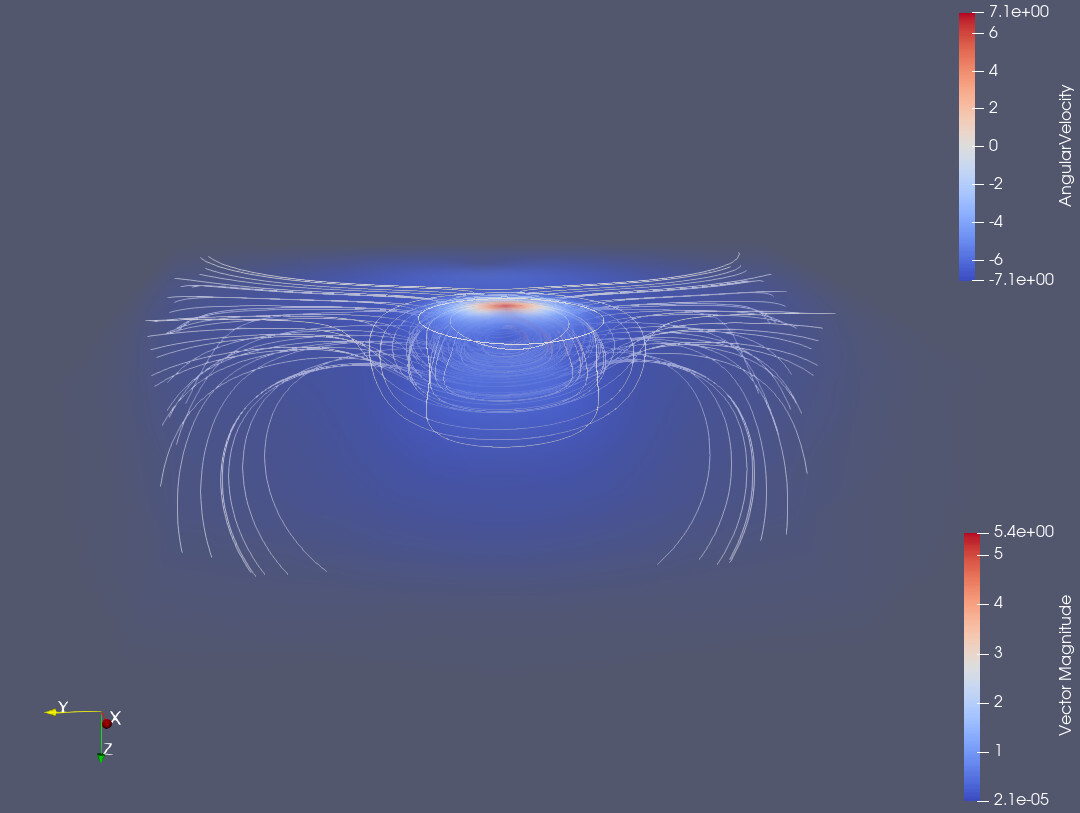
I have a CSV file containing six columns - x, y, z, Jx, Jy, Jz. I need to create streamlines to visualise the vector field J. What is the correct way to do so?
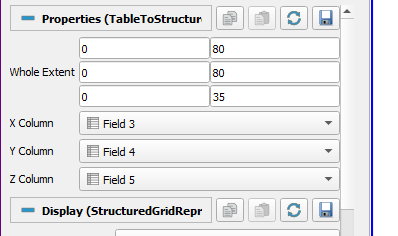
I tried several things but neither worked out so far. I tried Table to Structured Grid and specified the columns to Field 3, Field 4 and Field 5, i.e., the vector components. For Whole Extent, I entered the number of elements on the grid minus 1. In the output messages, It says that The input table must have exatly 1 rows. Currently it has 236196 rows. I don’t understand what it means.
I tried generating a generic file for a 3x3 grid and the Whole Extent 0 - 2 on all dimensions but that was not working, either.
I came across this thread where they suggested using the calculator filter.
I entered the following
“Field 3”*iHat+“Field 4”*jHat+“Field 5”*kHat
and in the Information section I can see a 2D array:
Result double [-4,4], [-4,4], [0, 3.5]
The Stream Tracer is grayed out. How can I turn the calculator output into a 3D array?
I use Paraview 5.12.0 on Windows.