EDIT: since ParaView 5.9, Catalyst was refactored and the following may not be relevant anymore
Catalyst is the part of the ParaView framework dedicated to the in-situ analysis, i.e. the processing of data on the simulation side, at the time of the simulation.
Catalyst allows minimal modification on the simulation code (4 lines of codes are enough once linked to a Catalyst Adaptor !) and modifying the processing pipeline does not require any programmatic knowledge. Simulation code in python, C, C++ and fortran are supported (in fact, any language that can use a C interface)
Architecture of a Catalyst Project
- at one side, your simulation code
- at the other side, the ParaView framework (see Catalyst Editions)
- between them, the Catalyst Adaptor : a thin interface to manage communication between simulation and paraview
- optionally, but very likely, a python script to configure the paraview pipeline.
The Adaptor
Has two roles:
- it runs a ParaView pipeline, through a vtkCPProcessor object. The easiest way to initialize this pipeline is to use a python script exported from ParaView. During the update step, the adaptor should set a VTK Object as the pipeline input data.
- (optionally) it converts your simulation data to a VTK Object(s) (zero-copy most of the time).
This object will be the input of a ParaView processing pipeline
Example : python simulation and Live Visualization
Setup
Download ParaView 5.8 and the PythonFullExample post release 5.8
fedatastructure.py: simulation internal code : does not know about catalystfedriver.py: simulation code, containing the main loop : call the adaptorcoprocessor.py: the adaptor, called by the driver and initialized with a pipeline script.cpscript.py: a pipeline script, exported by ParaView.
To enable the LiveVisualization, modify cpscript.py (line 56) :
coprocessor.EnableLiveVisualization(True, 1)
Run
Launch ParaView. Go to the Catalyst menu and click connect. A pop up raises, asking for a port connection. Validate with the default 22222 value. Another pop should say that ParaView is now waiting for a connection.
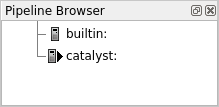
A new server appears in the pipeline browser, named ‘catalyst’.
(1)
hint : check Catalyst/Pause Simulation. As the demo is quite short, it is useful to pause before the connection happens.
Now you are ready to launch the simulation !
$ ./bin/pvbatch ParaView-v5.8.0/Examples/Catalyst/PythonFullExample/fedriver.py ParaView-v5.7.0/Examples/Catalyst/PythonFullExample/cpscript.py
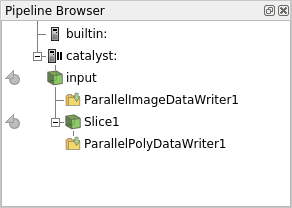
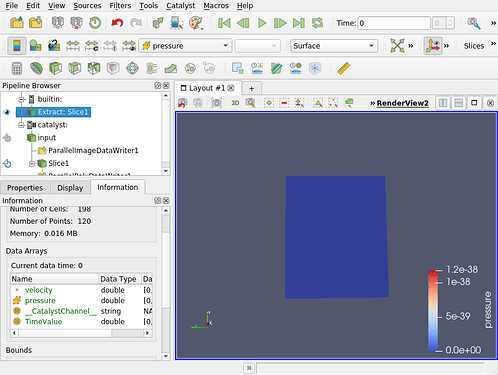
Now new sources has appeared in the pipeline browser (2). Note that to preserve your computer memory (and network) only metadata has been transferred.
(2)
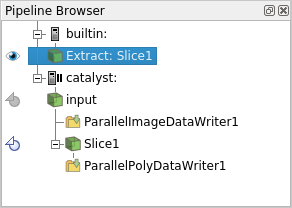
Click on the icon left to it in order to fetch the actual data (3), and be able to display it in ParaView (4)(don’t forget to click on the eye to set the visibility !)
(4)
The simulation is still paused here.
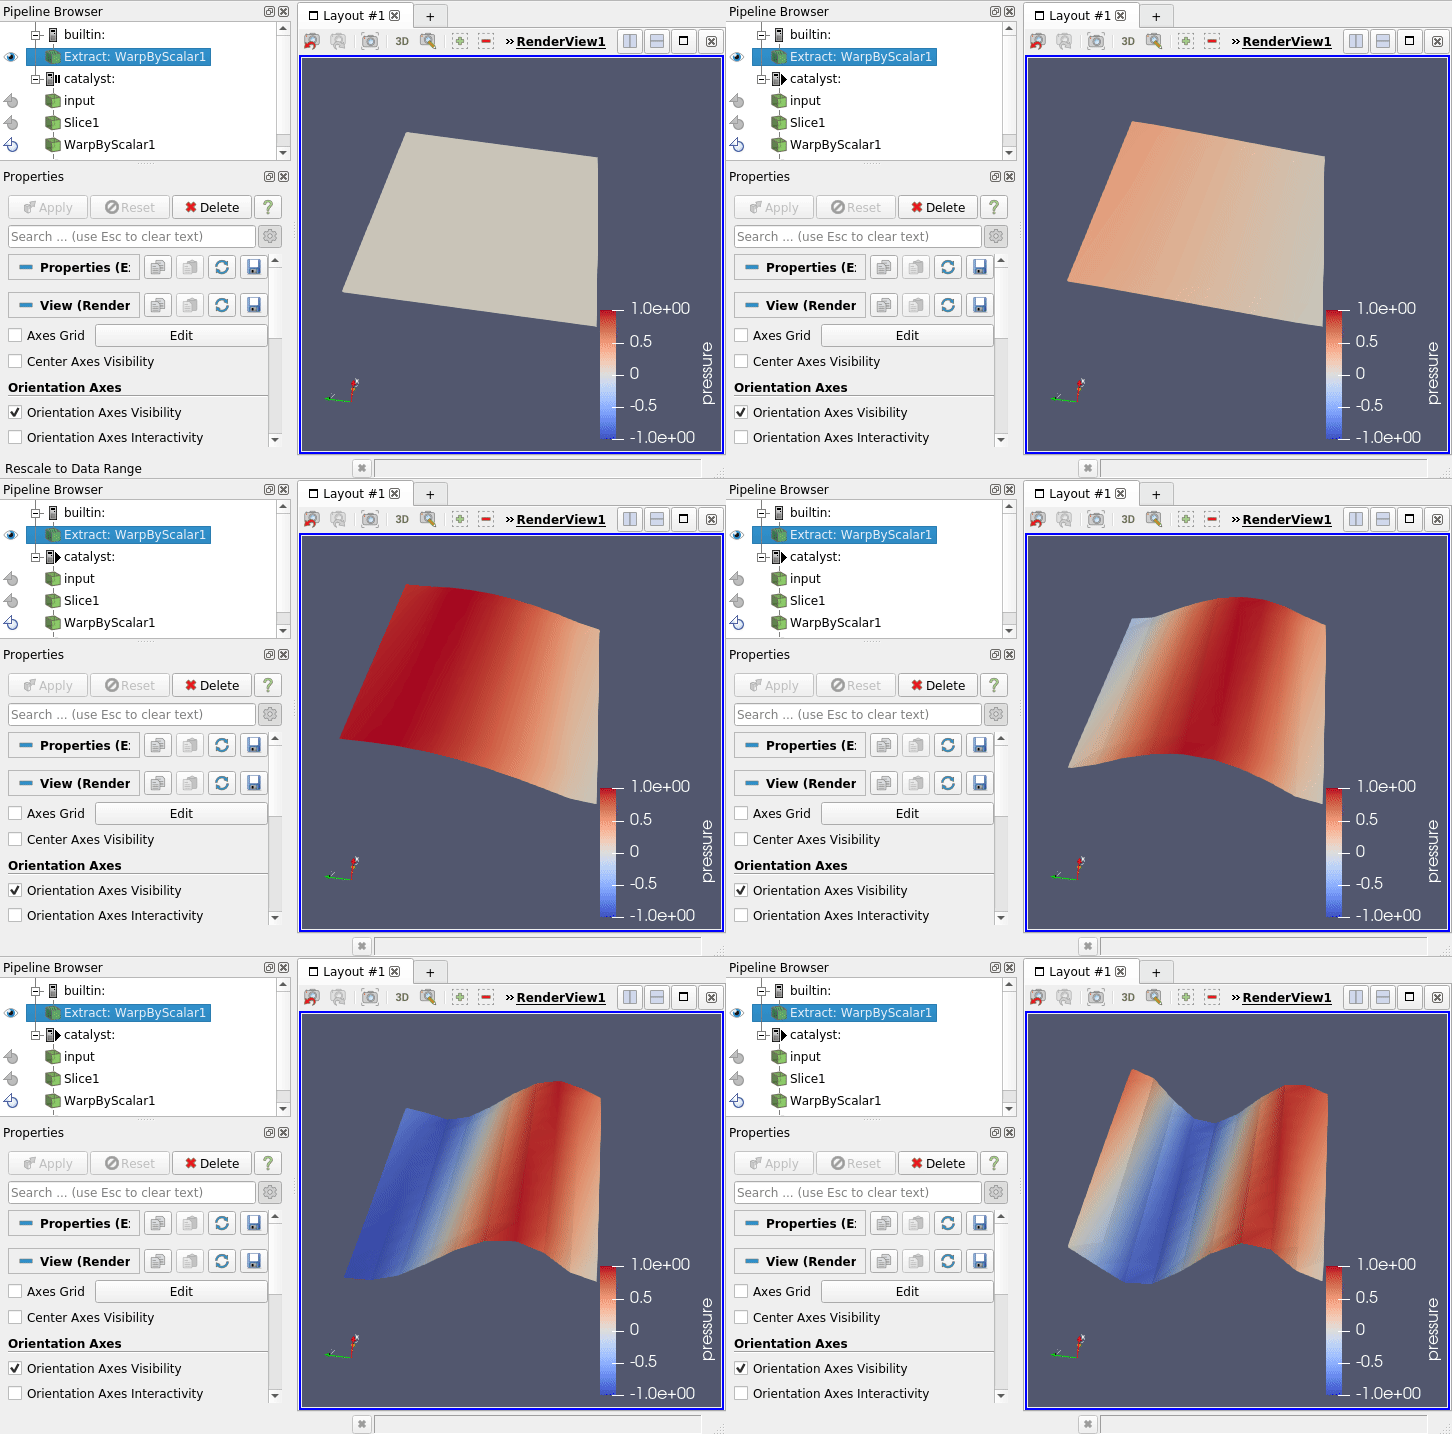
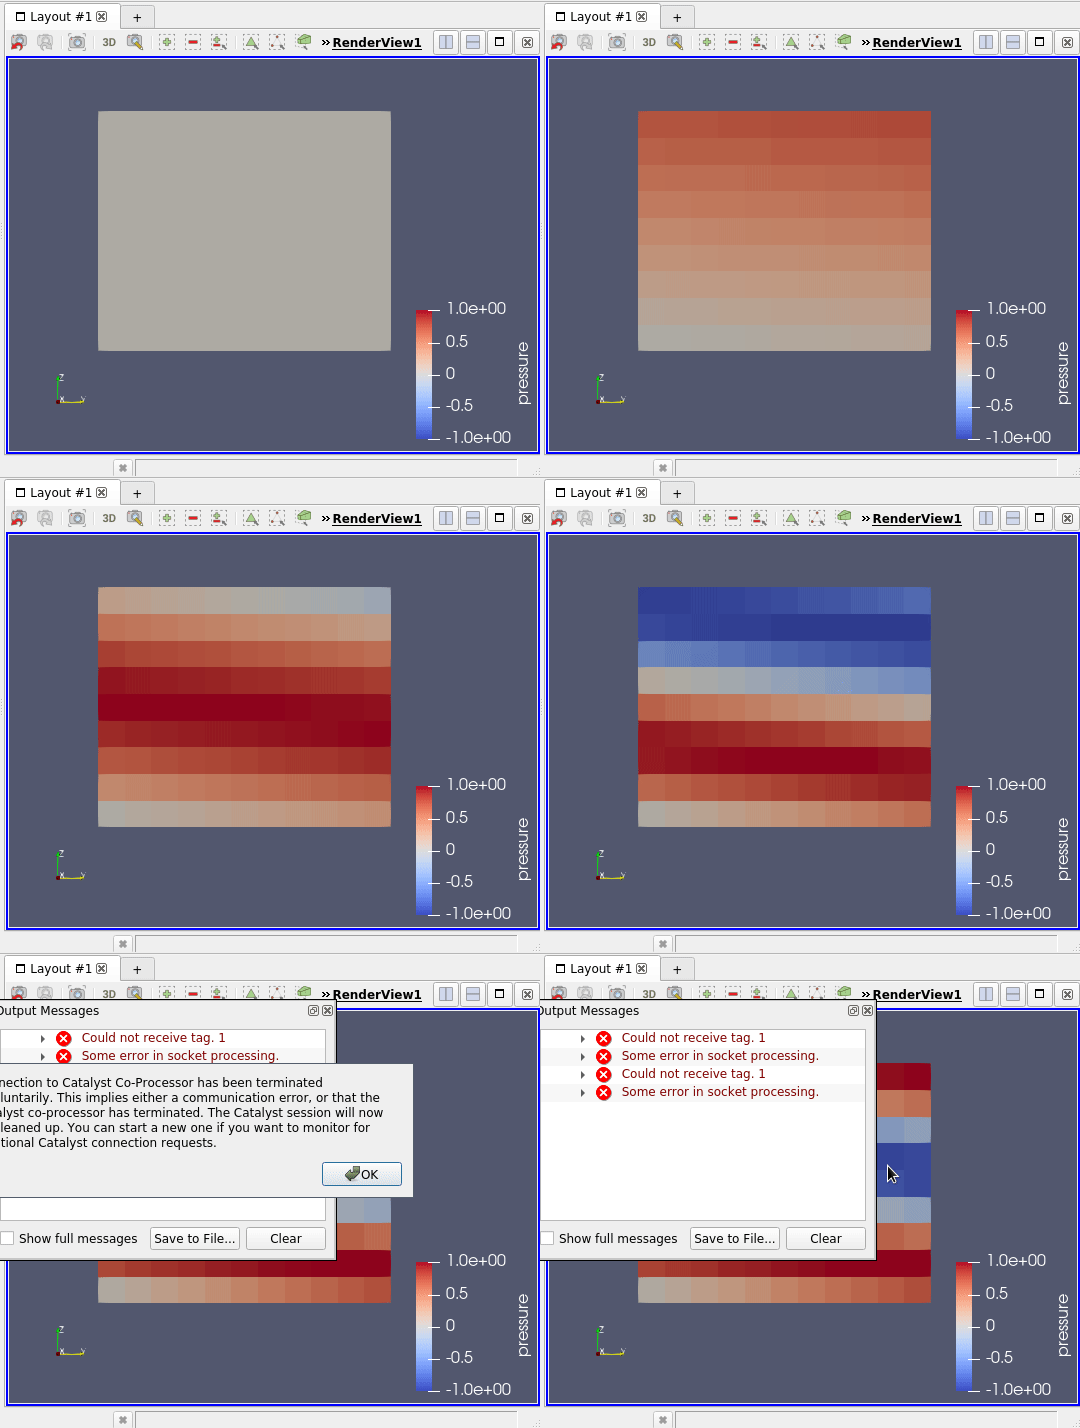
You can now unpause it via the same menu (Catalyst / run) and see your simulation data being updated on the screen ! (5)
(5) 
hint : in this example, one time step is quite quick so maybe the visualization will jump and drop some of the timesteps … don’t hesitate to modify the code !
The simulation ends and stop the communication. A message box pops in ParaView and the catalyst part of the pipeline is removed. But the extracted data is still here !
Configure the pipeline
You can try replacing the cpscript.py by your own exported from ParaView.
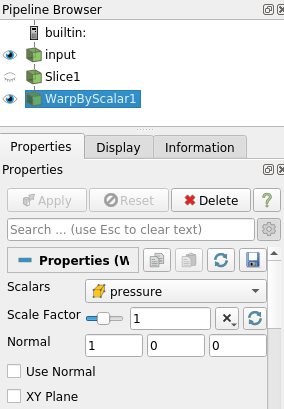
First load a representative dataset, i.e. a dataset with the format (structured grid, polydata …) and data arrays named as in the simulation. In our example you can load the fullgrid_0.pvti created by the previous run. Then set up the pipeline you want. (6)
(6)
Click on the
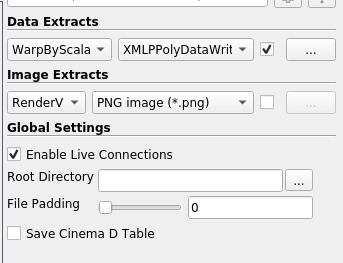
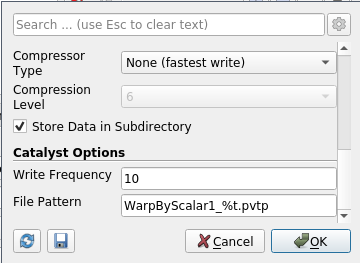
Catalyst/Define Export menu to open the Export Inspector. Here you can select a writer for your source, take screenshots and enable others live visualization (7a). Writers can be configured (7b).
(7a)
(7b)Save the script with
Catalyst/Export script.
You can re run the simulation with your new script !
(8) 