I have a few questions about PataView:
1-Is it possible to customize the min/max stress values displayed on the legend? If yes, how?
2-Is it possible to export the node stress of a certain analysis from ParaView?
3-Is it possible to know the stress of a certain point by clicking on it? A sort of query tool.
Use the “Rescale to Custom Data Range” button from the top toolbar for this purpose.
If you want to export all stress values to a text file or spreadsheet, use File → Save Data, specify the name and choose the “Comma or Tab Delimited Files” type, then check “Choose Arrays To Write” and select the variables that you want to export.
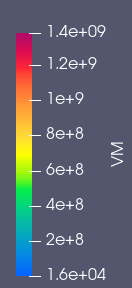
Thank you. About the point No.2, is it possible to change the unit of measurement of the stress from Pa to MPa? It feels weird looking at values of “2.5e+8” without any explicit unit of measurement.
I convert the file .frd by FreeCad into .vtk. The .frd file has N and MPa, but I dont know if in .vtk they are modified. I think it is converted into Pa beacuse of the different exponential notation 2e+3 in .frd vs 2e+8 in .vtk. I don’t think that the data are corrupted.
I noticed that the exported file is not so clear. It cannot be correctly imported in excel beacuse it’s like they are all in the same cell. I have the same issue if opened with notepad.
Excel has quite a lot of options for data import. You can set the delimiter, among the others. Also, both Excel and text editors (including Notepad) can replace text in the whole document so you can change dots to commas, remove spaces and so on.
And make sure that you are exporting to .csv instead of .txt.
Thanks.
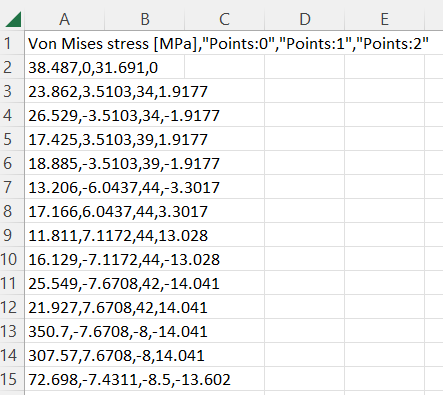
I exported the .csv file, but what I see is not so clear. I activated the option ‘‘meta data’’ on ParaView. But what does point 0,1,2 mean? Are they point coordinates?