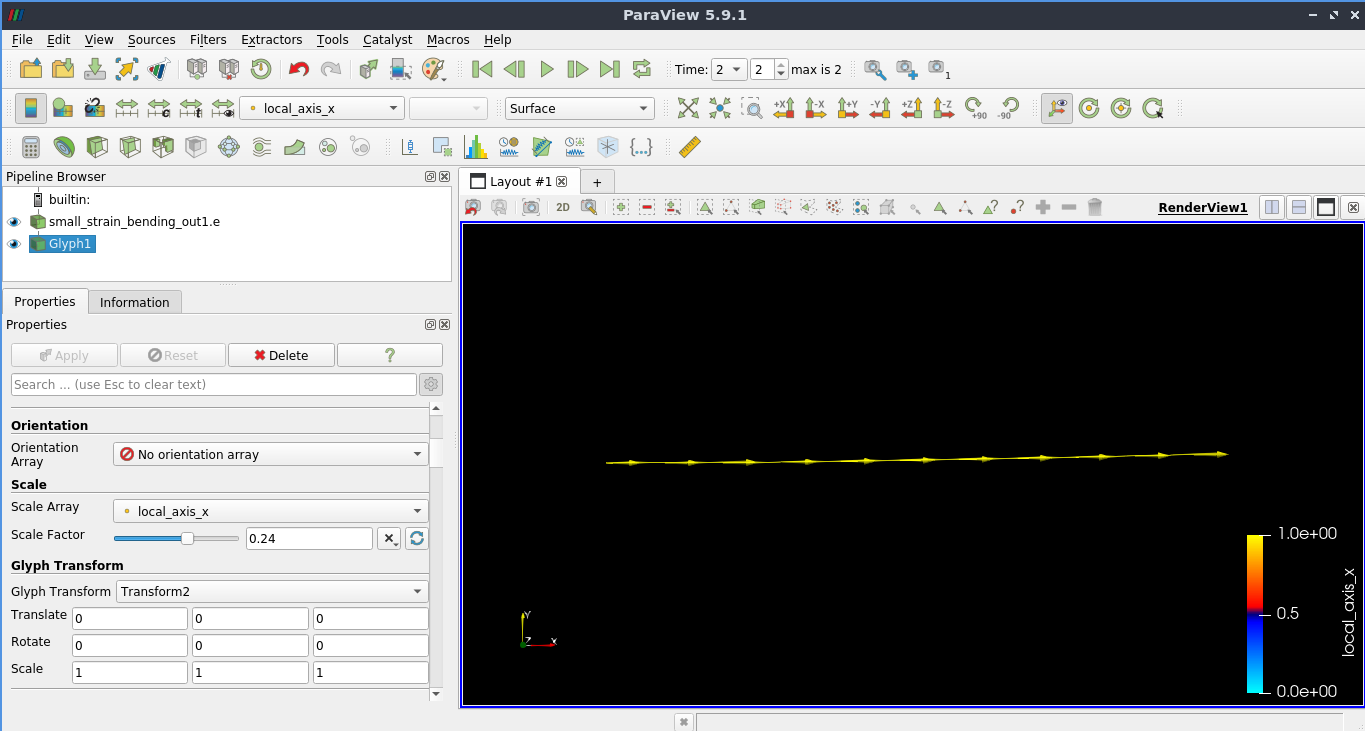
Hello. I currently try to visualize exodus file, obtained as a result from MOOSE framework. There is an issue with local axes displaying: they are displayed at the nodes, but i need it to be assingned to elemetns.
Thank you. Does then a glyph filter must be inside CellCenters?
If it is true, then i can’t acces to my data “local_axis_x”, which was available when I used the glyph directly.