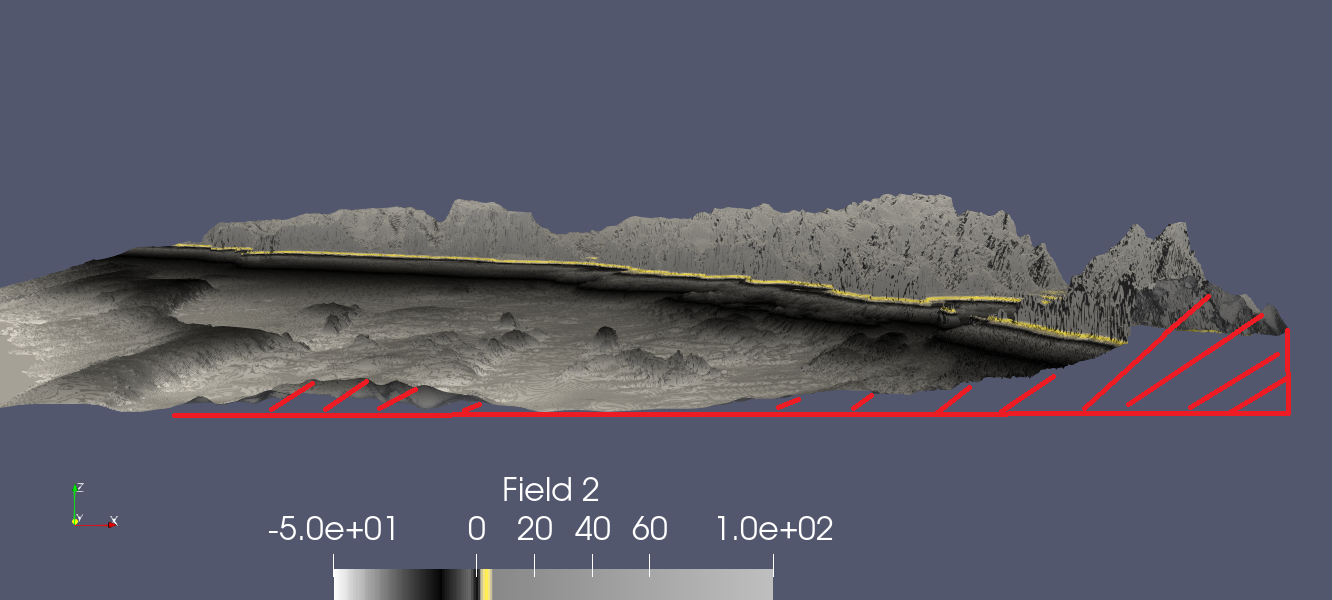
But I now have another problem. I want to have some sort of non linear extrusion that will fill the void created by warp by scalar, something like this :
I’ve used the linear extrusion, it is quite nice for water, but has two major problems:
I either have a reflect when I’m putting just enough water, or when I avoid by making the water far below seabed, it is just too unrealistic when side viewing.
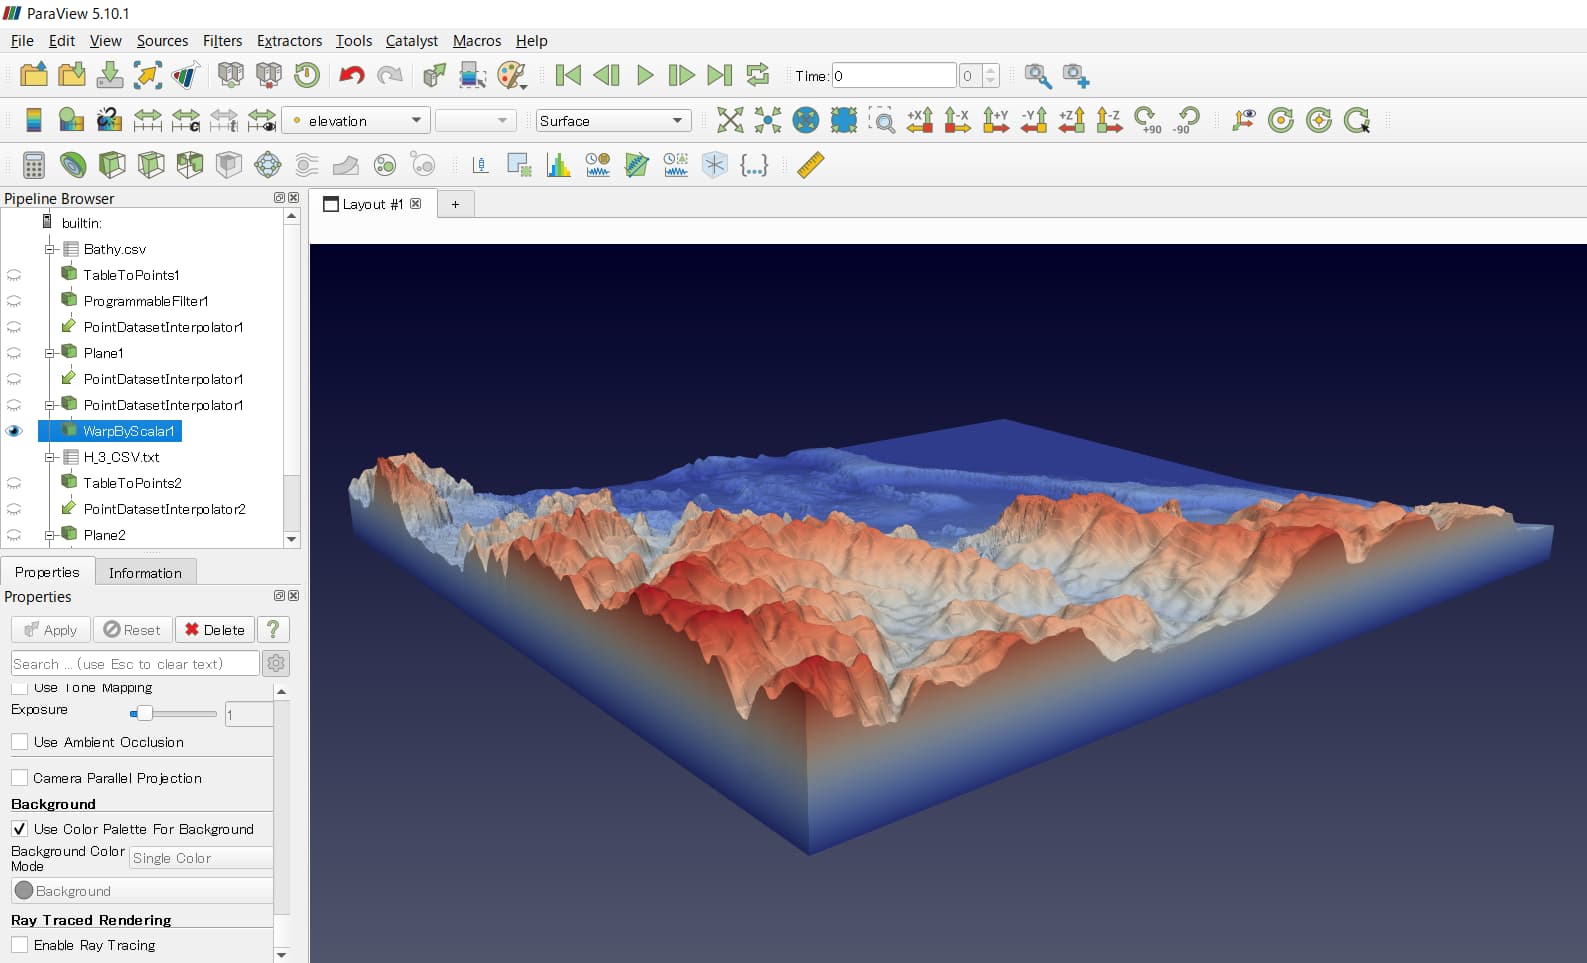
My filters for the moment:
Bathy.CSV
Tabletopoints
Point dataset interpolator applied on a plane source the same size of bathy (14500x13000, precision of 4000x3500)
Warp by scalar
Smooth if I want a better looking plane, not necessary for testing
I’m pretty sure the answer is with the calculator filter but I can’t figure out how.
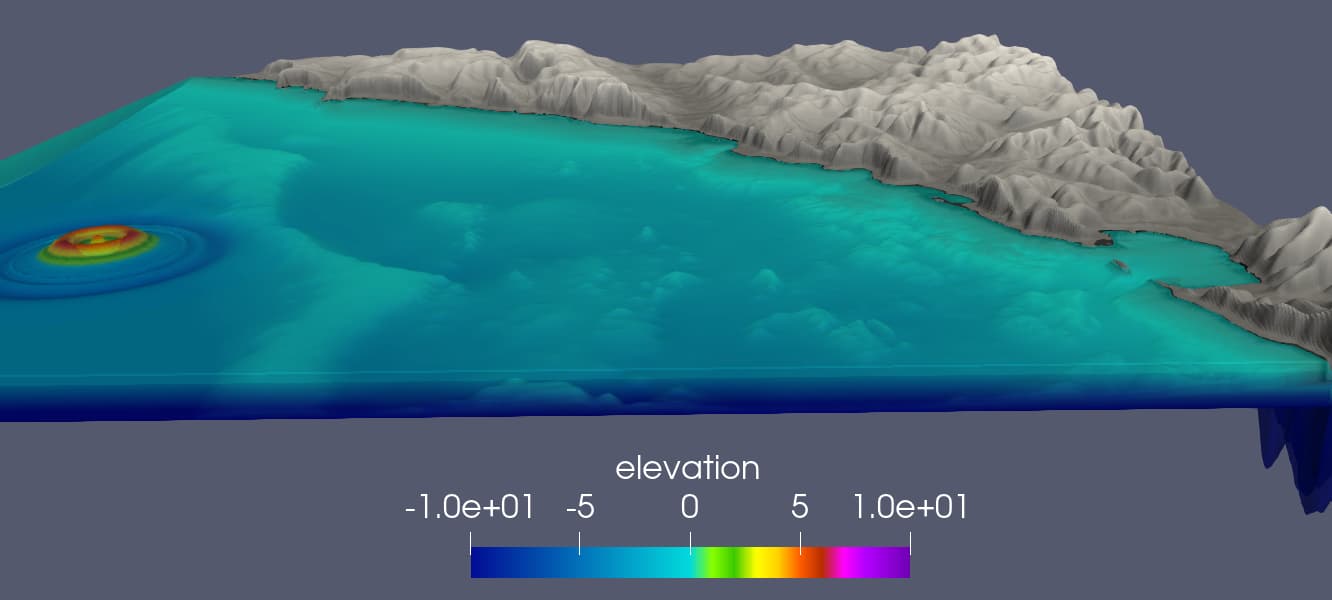
If you replace the elevations at the points in Bathy.csv that form the boundary with the minimum elevation, you can create sides when you apply Warp By Scalar. To do this, you may want to use the following Programmable filter for TableToPoints for Bathy.csv.
import numpy as np
from vtk.util.numpy_support import vtk_to_numpy, numpy_to_vtk

input0 = inputs[0]
bounds = input0.GetBounds()
print(f'bounds: {bounds}')

field2 = input0.GetPointData().GetArray('Field 2')
min_elev = field2.GetRange()[0]

points = vtk_to_numpy(output.GetPoints())
print(len(points))
num_pnts = len(points)

elevation = np.full(num_pnts, min_elev)

for id, (x, y, z) in enumerate(points):
    if (x <= bounds[0] or x >= bounds[1] or
        y <= bounds[2] or y >= bounds[3]):
        continue
    elevation[id] = field2.GetTuple1(id)

output.PointData.append(elevation, 'elevation')
This allows the result of the Warp By Scalar filter to have sidewall surfaces.
First, thanks a lot! That was exactly what I was looking for. Your topography color map looks really nice. Is this a color map you created?
I loaded the state file, but I got an error when I enabled the Ray Tracing. I have four of them :
Generic Warning: In C:\bbd\ecd3383f\build\superbuild\paraview\src\VTK\Rendering\RayTracing\vtkOSPRayMaterialHelpers.cxx, line 283
Warning: unrecognized material “”, using a default OBJMaterial
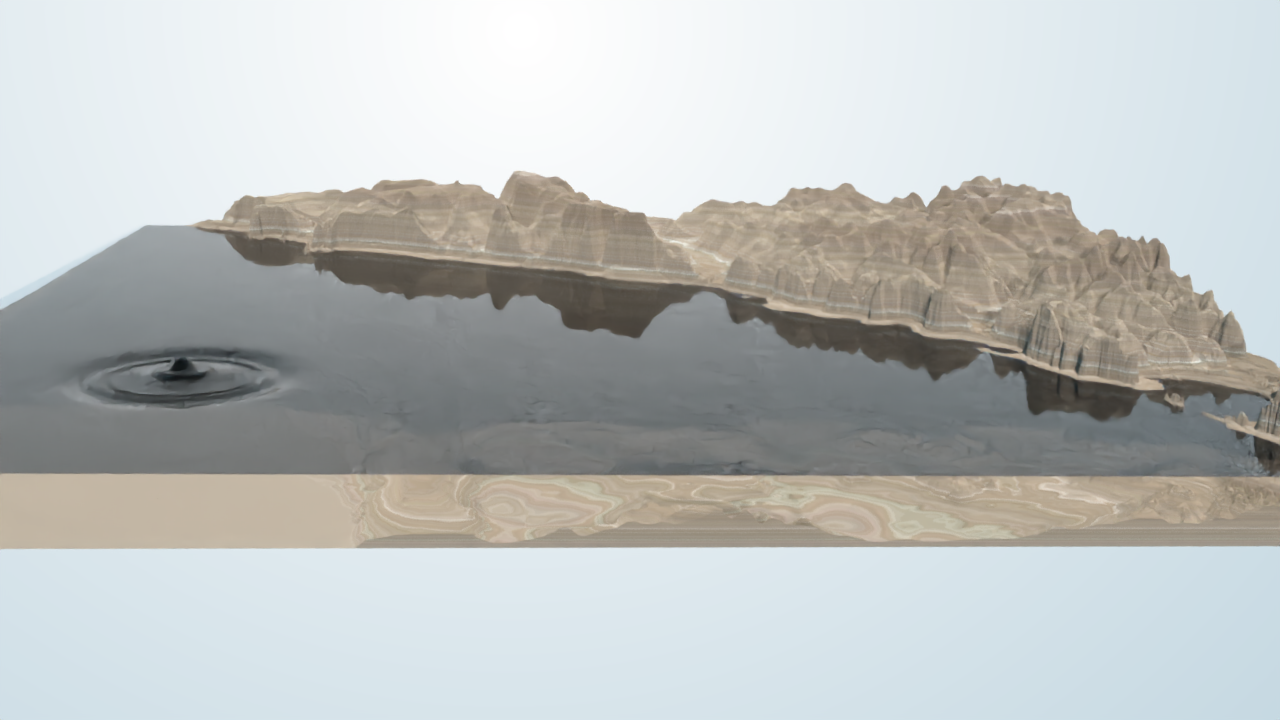
The Ray Tracing does not make the reflection disappear though. It wasn’t really a reflection, but just the consequence of the use of Linear Extrusion. The free surface is going up, thus the bottom of the extrusion does the same. I modified just a little your programmable filter by modifying the minimum value to an arbitrary one (The bottom of the seabed here) and it now looks exactly how I first imagined it ! Without the reflection.
But I don’t know how to automate it, as I’m using the limit of different sources, and that I also want to use different scale factors for bathy and free surface, to make the wave variations more visible. But that’s not a big deal, It is easy and quick to change the minimum value.
What color is your water? Grey with an low opacity?
Those programmable filter seems to be really flexible, I might try to learn how to use them. I’ve been using Paraview only for less than a month.
It appears that your version of ParaView is out of date. With the latest ParaView, you can use a large number of path tracer materials for more realistic rendering.