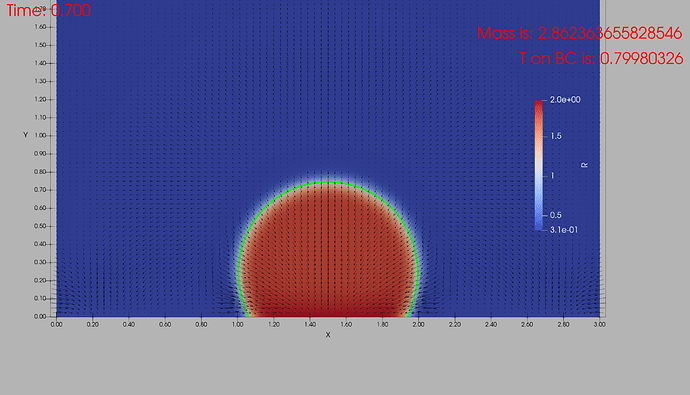
Hi to the community!
I am doing some research in droplets and I am using phase field methods to solve some droplets in a domain. To visualize I am using ParaView looking into the different fields of the system. My droplets are defined by the density field and the “interface” I set is located at a constant value of my density. To be able to visualize such an interface I use a contour filter. That draws a line as the one I am showing in the image attached to this post (green line). Over the time (on each time step) this contour is changing position (due to the droplet changing in shape).
I would like to be able to plot quantities over that contour. I know that that contour is, so far, a bunch of points that happen to be next to each other and, in order to plot, I would have to have a curve that follows this contour (just theorizing here).
I don’t even know where to start looking. Even though I had used ParaView before, it was only to a certain extent, so perhaps there are many things I should be able to do that I have not realized.
Thank you all in advance!
Julián
