There has to be a way to visualize the surface Mach plot or Cp plot from a 2D simulation. I cannot figure out the feature set where I can either extract the data from a polyline or the feature to look at the surface profile on the wing. Attached is the vtk file for our perusal.
Apply the Feature Edge filter to Paraview_Help.vtk, with only the Boundary Edges option enabled, to extract the airfoil and outer boundaries.
Apply the Connectivity filter. At this time, change the Extract Mode to Extract Closest Point Region mode and specify a point on the wing surface as the Closest Point to extract only the airfoil.
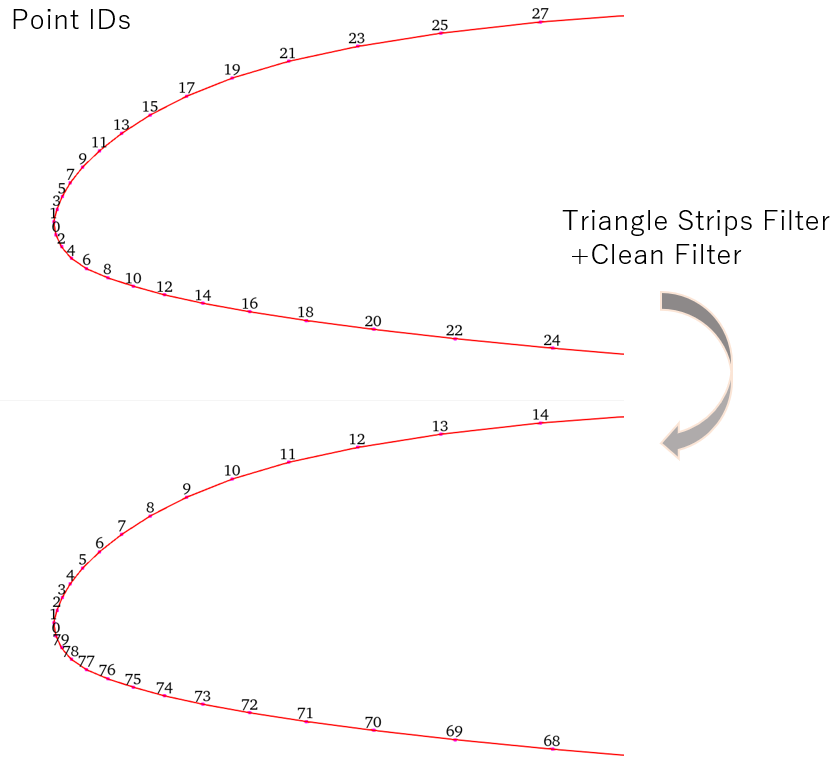
Use the Triangle Strips filter and the Clean filter for aligning the point IDs so that they are in order around the airfoil.
Finally, plot the results with the Plot Data filter.
Hi, thank you so much. This does solve the issue and I am able to visualize the plots. If I could seek your attention again, I would love to understand -
What are the triangle-strips filter and clean filter doing?
The pvsm file that you mailed out would run into Errors on opening. Also, from my personal experience, I have noticed that if I rename the folder/file I run into similar issues. How does one use the save state feature and still be able to move the file around successfully?
What does save data as a pvd file do? Is this a better format to save the information and the plots in the Paraview format?
The Triangle Strips and Clean filters allow you to turn fragmented line segments into a single polyline and order the point IDs that define the polyline, as shown below:
When opening a pvsm file created in a different environment or situation, you may need to change the Load State Data File Options to Search file under specified directory or Choose File Names.
The pvd file stores time information, geometry and data, but does not store the visualized state. I think the only way to save the visualized state is to use State File (*.pvsm or *.py).
Thanks a lot. That does make ParaView more approachable for me.
Also, if I may pick your brain at this juncture, is there a way I can extract data of a polyline? The polyline itself being offset by 1cm or even 1 cell distance of the Boundary edge line data we are looking at here.
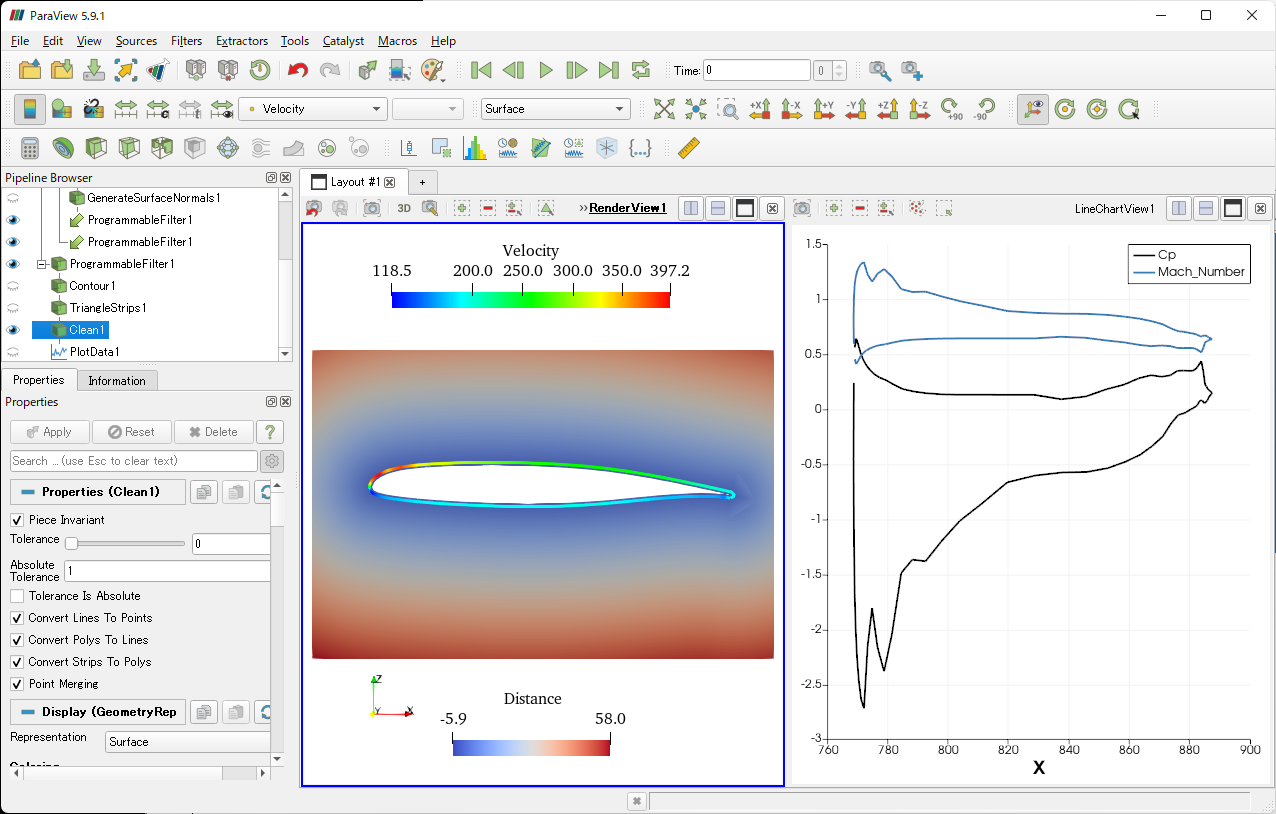
One way to offset the boundary edge is to calculate the signed distance from the boundary and then extract the lines at the offset distance specified by the Contour filter.
For details on how to calculate the signed distance using the Programmable filter, see below.
The above operations are a bit complicated, please refer to the State file below. plot_mach_and_cp2.pvsm (995.9 KB)
All filters included in the State file are required. The process performed in the State file is as follows:
Extraction of airfoil shapes (FeatureEdges1, Connectivity1)
To calculate the signed distance from the airfoil to each node in the analysis domain, extrude the airfoil in the z direction to create a 2D surface of the airfoil and calculate the normal vectors on the surface (LinearExtrusion1, GenerateSurfaceNormals1)
Calculate the signed distance: in the Pipeline Browser, select GenerateSurfaceNormals1, LinearExtrusion1 by holding down the Crtl key in that order, and then launch the Programmable Filter ( ProgrammableFilter1)
Extraction of offset line (Contour1)
Plot values on the offset line (TriangleStrip1, Clean1, PlotData)
I am using it on my 3d blade vtk file, it is somehow not working, maybe something needs to be adjusted since yours is I believe 2D?
To briefly explain what I am trying to do… I have two-phase simulation of a a centrifugal pump, an impeller with blades, and i want to find the gas volume fraction at an offset of say x cm each of the blades. So I want to slice the blades and offset it. And I am not sure how to edit your pvsm to make it work for my case.
My state file was created for 2D, as you say. If you want to apply this state file to a 3D blade, you would first need to create a section of the blade of interest, using the Slice filter.
Ok, so here is the file i created with a Slice filter, and here are the VTK files. I am not sure which one will work, since i tried the the blades and also the main VTK file and nothing is being plotted. Isosurfaces array in the Contour filter is somehow empty in my case.
Can you please advise? I would really like to plot the gas volume fraction an offset around my blades… (in the blade passages)
**** Is there another way to do it? maybe with a polyline? I have tried slicing along a polyline that but ended up failing… Maybe I will open a thread with it.
Attached are the needed state and VTK files. I am not sure which VTK is needed btw, maybe you can advise?
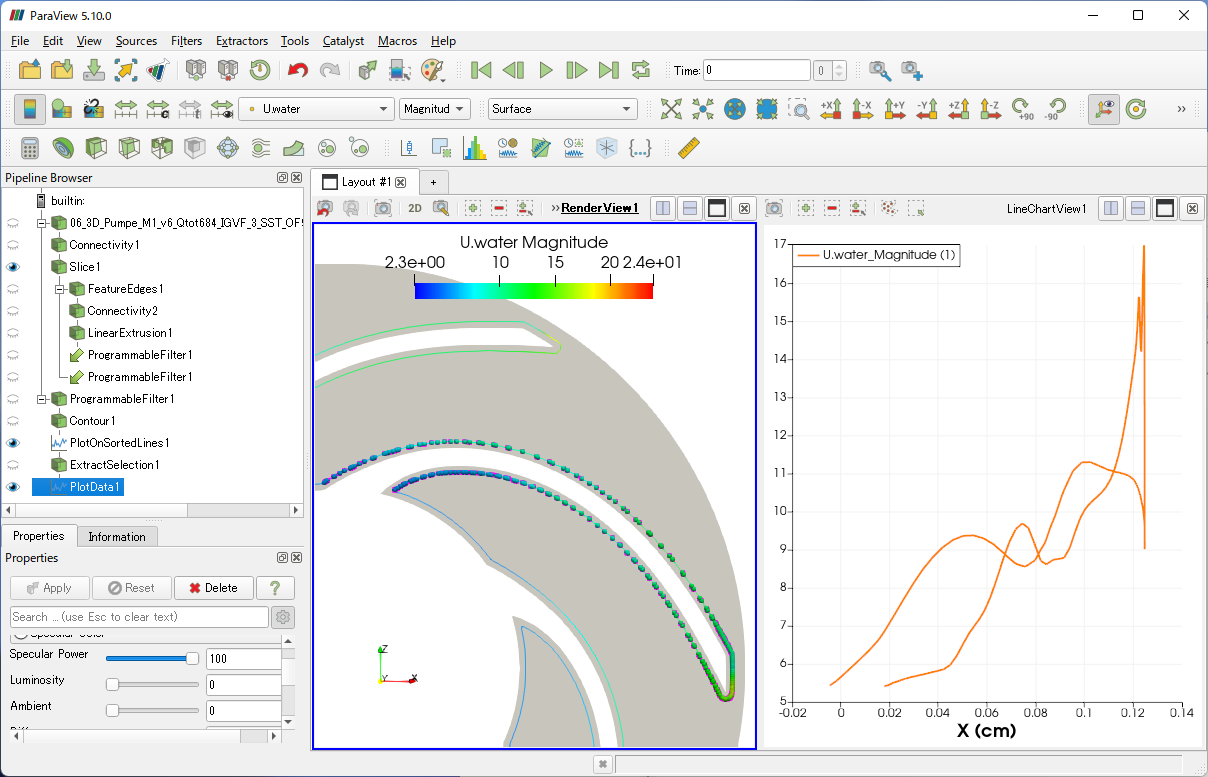
as input and creates a plot on a line offset from one blade. Offset_on_blade.pvsm (1.2 MB)
PlotOnSortedLines1 and ExtractSelection1 in the State file:
The Plot On Sorted Lines filter is useful because it automatically sorts the point sequence on the offset line (Countour1). Please note that if you change the amount of offsetting, you will need to re-select the IDs of the points for the target blade in PlotOnSortedLines1 using the Find Data tool and extract them again using the Extract Selection filter.
** What I would like to do is not really an offset, but rather take a polyline with exactly between two blades and plot against it. But I came across this thread and thought it might be an option, is there an easier way to do it? Since having an offset gives me two lines in the middle of the passages. Here is the thread i opened about it: