Hi all,
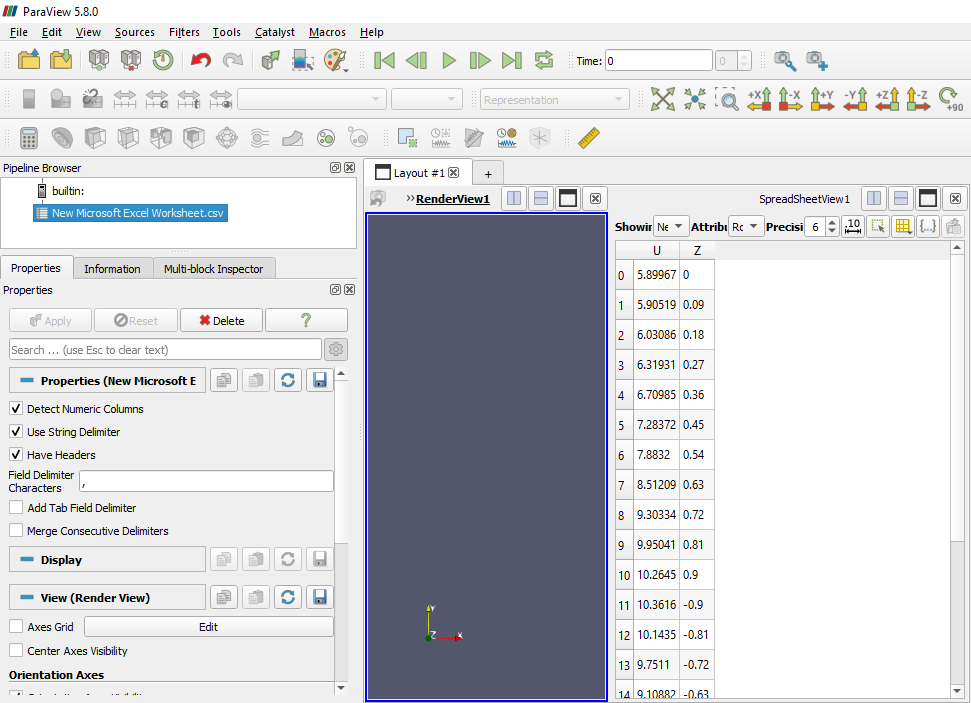
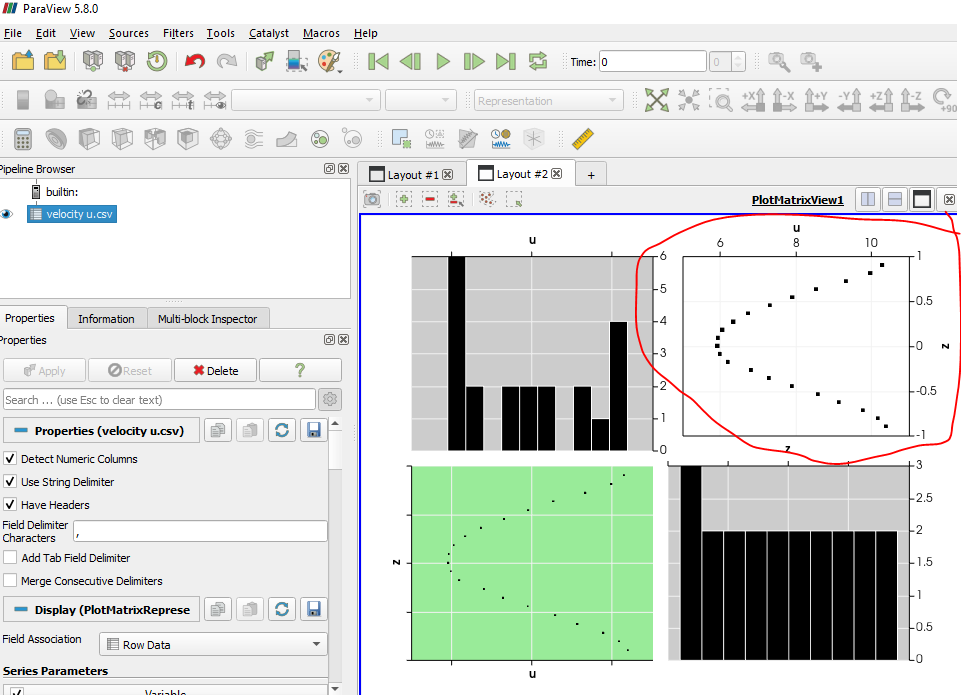
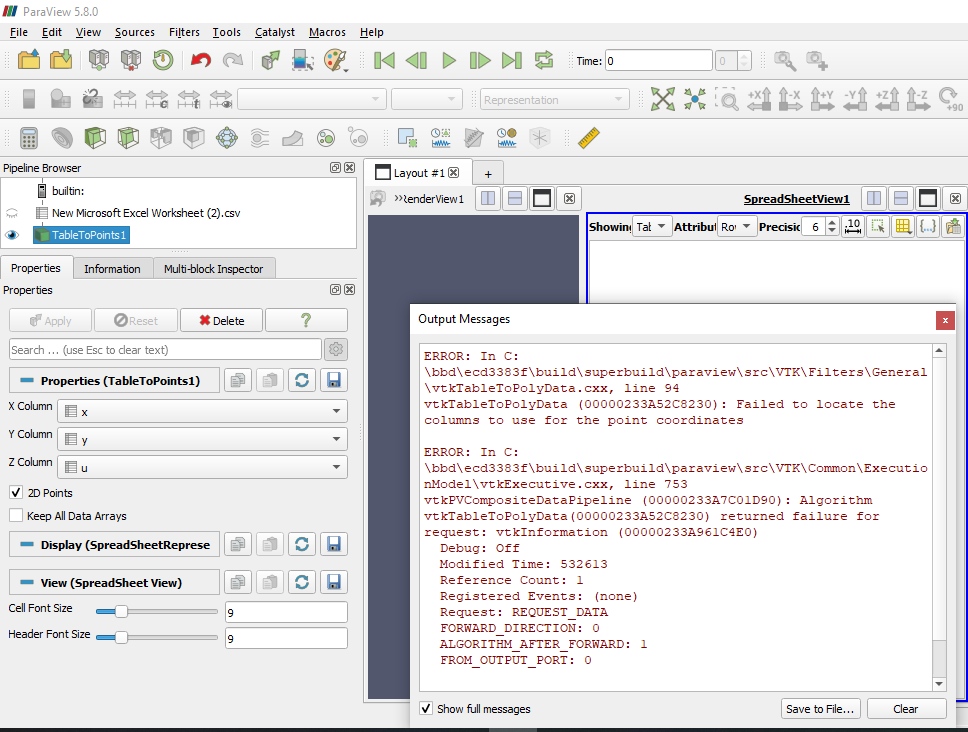
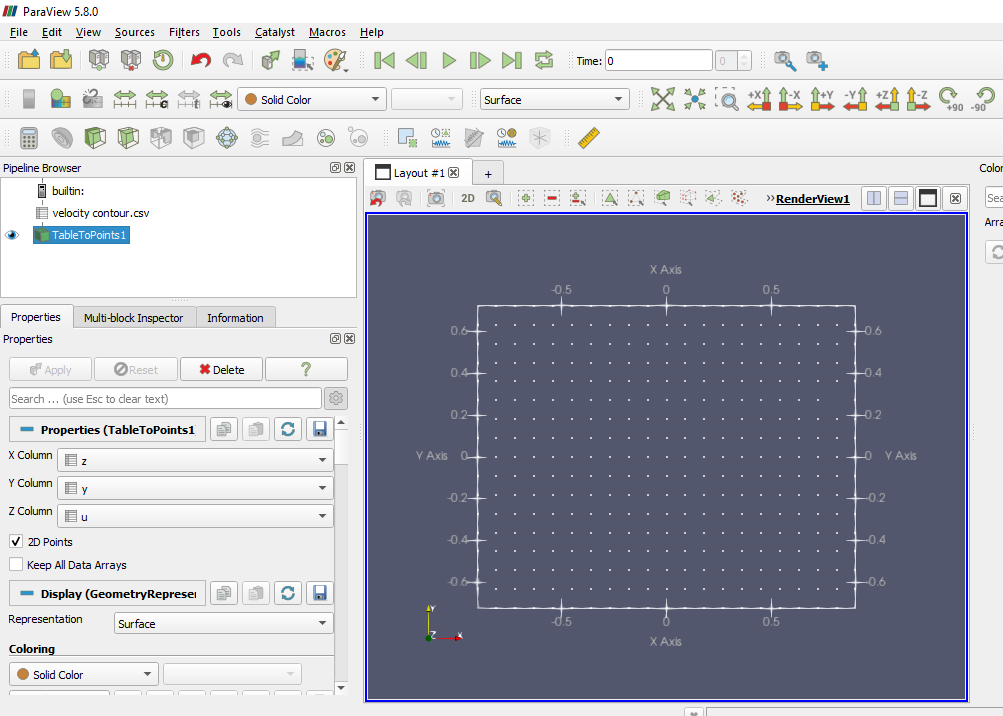
i would like to ask about plotting line from csv file. the csv file contains two columns, one for the z-axis and the other for the velocity. i tried to plot the line chart view, but at setting z to be the x array error is encountered and nothing is done
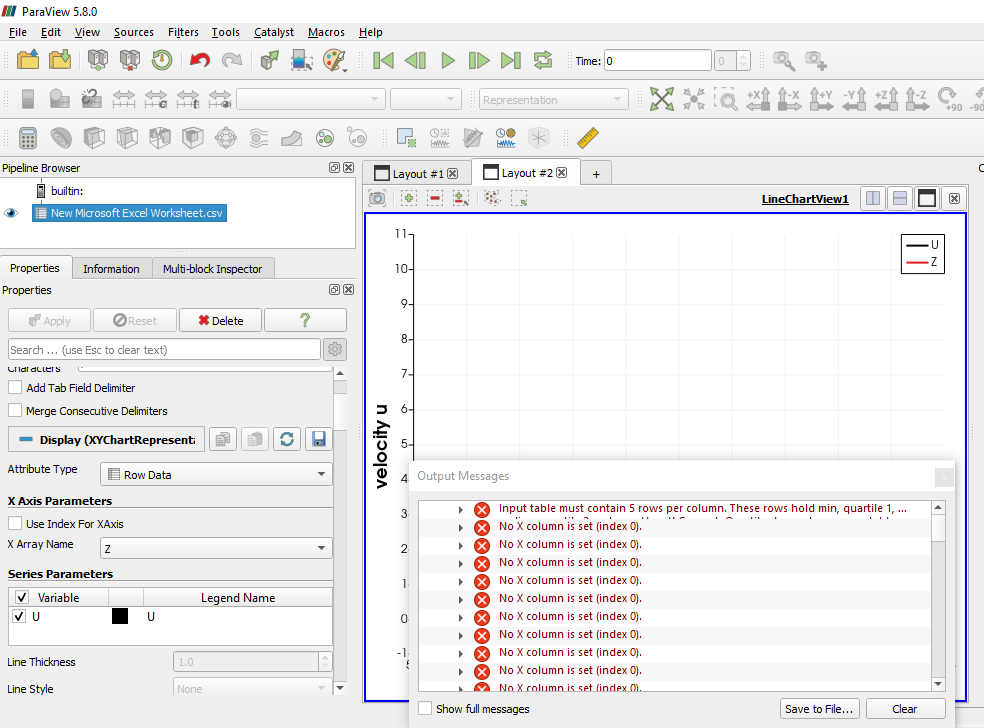
Can you share your dataset ? This should work out of the box.
velocity u.csv (344 Bytes)
There is a bug in the delimited text reader for header names without quotes.
Just add quotes to the first line for work around it.
"Z","U"
Here is the logged issue : https://gitlab.kitware.com/vtk/vtk/-/issues/18015
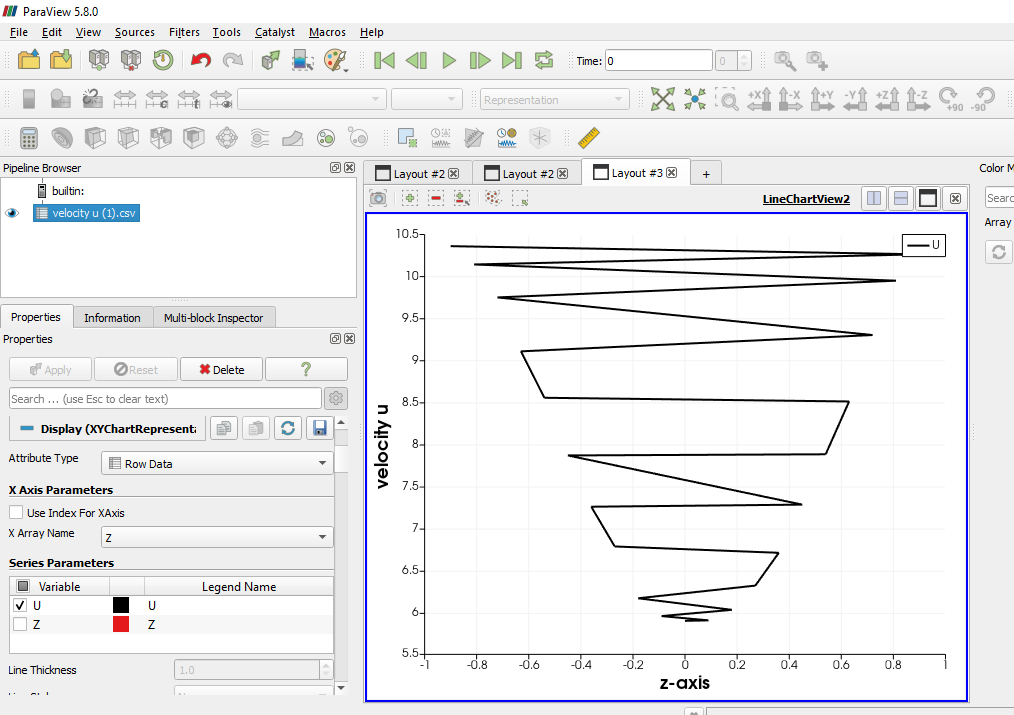
thanks for your quick reply, but when i added the quotes, the velocity column was deleted. velocity u.csv (356 Bytes)

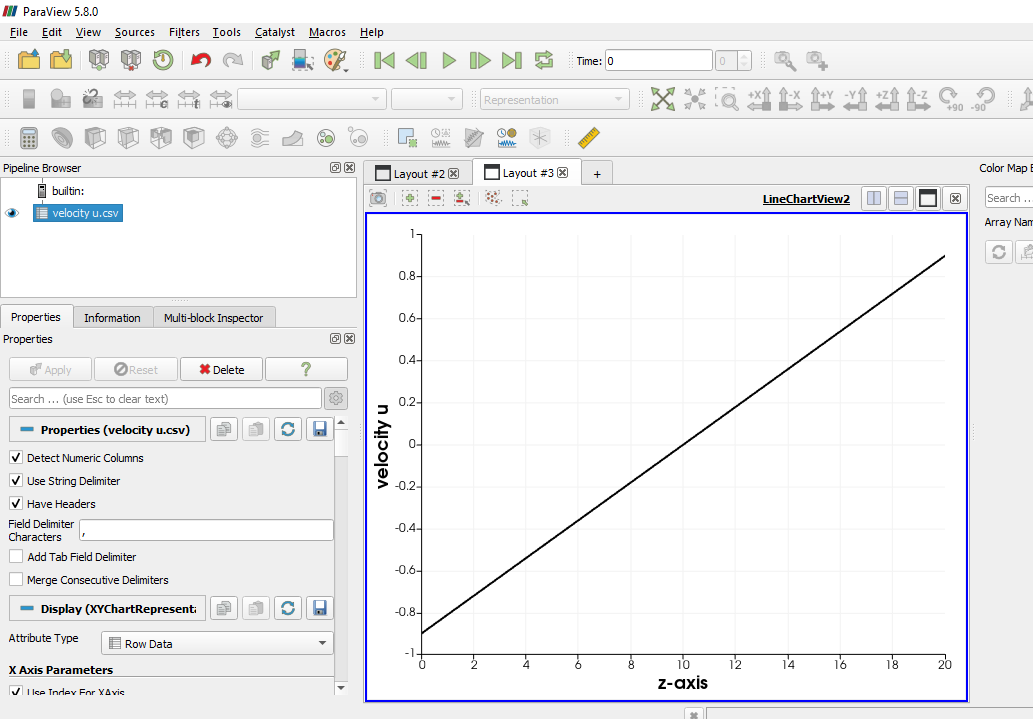
This file works perfectly for me: velocity u.csv (348 Bytes)
It looks like something (probably MS Excel) added a byte order mark to the file that is confusing ParaView. They are invisible in just about every editor I tried (or used to identify the file as UTF-8), but they showed up when I ran cat from a shell.
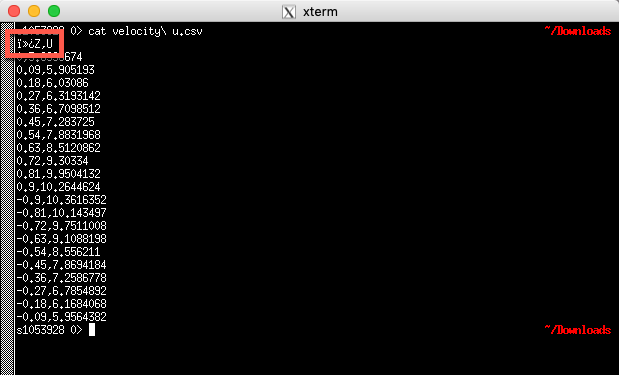
If you have it available on your system, you can use the dos2unix program on your system to strip that out, and then the file works. Or, like @mwestphal said, you can put the labels in quotes and ParaView will read it correctly.
This seems like a bug to me, so I filed a bug report: #20243.
Try turning on the Sort By X-Axis option in the Line Chart View.
yes, i get the proper curve by turning on the Sort By X-Axis option with the file sent byvelocity u.csv (348 Bytes) velocity u.csv (348 Bytes) @mwestphal
i also have a problem with plotting a contour of velocity at a section with two axis. i think the problem came from the csv file, too, as you mentioned.velocity contour.csv (7.5 KB)

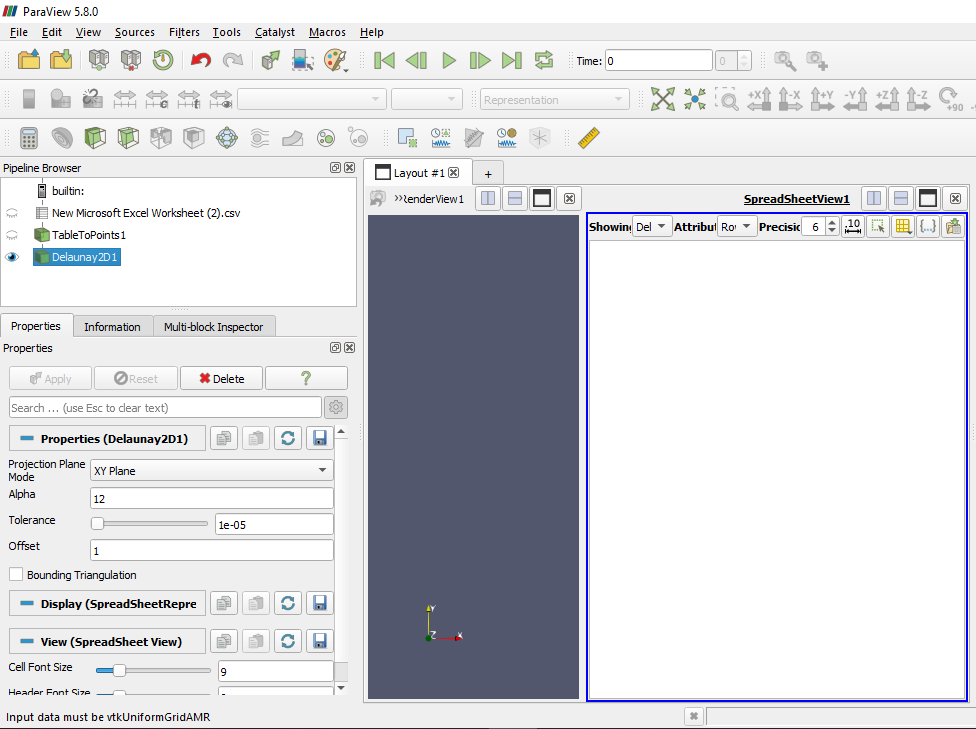
Yes. Same problem. Same workaround. Run the dos2unix Unix utility or edit the file to surround the header labels with quotes.
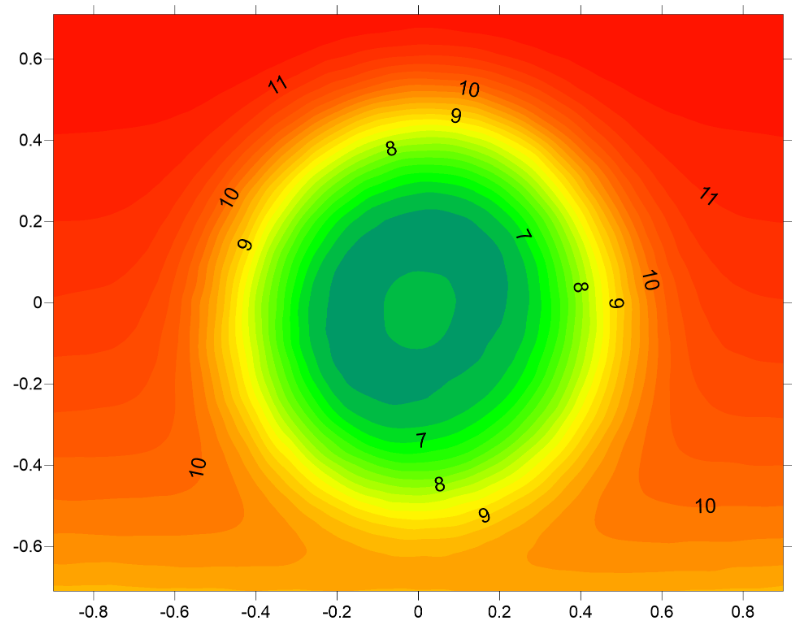

See this topic for the answer: 2D contour from .csv