Hello Experts,
Although there are many videos/posts related to plotting the streamlines but I could not achieve the desired plot for my 3D airfoil case. I followed the steps:
Implemented the filter “StreamTracer1” with a line that is close to the inlet of the computational domain.
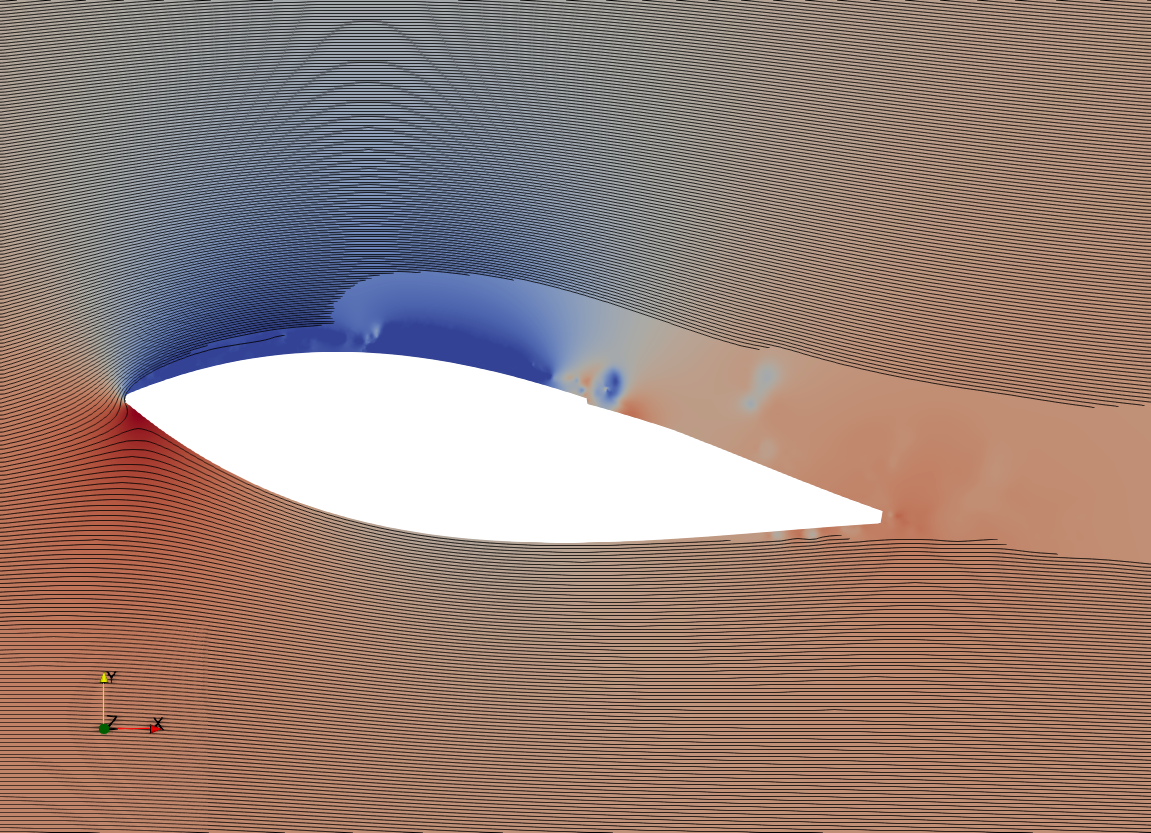
I am getting a bit of weird output that is attached herewith. I am not sure if my data set is wrong or my mesh (using unstructured mesh ). Any comment/suggestion will be a great help. Thanks in advance.
@mwestphal Actually nothing have changed even after using the “5.9.1-RC1” version. I am guessing some thing related to my mesh or my pipe is wrong. Could you kindly suggest something else. Thanks for your help and cooperation.
Thanks for your reply @mwestphal , my data is 3D and is about (system + constant + latestTime folder) 1.5 GB. Is this a good platform to share this huge data, could you kindly share your email id or so, also we may publish this work, so not sure if good to share in the public domain. What you suggest ?
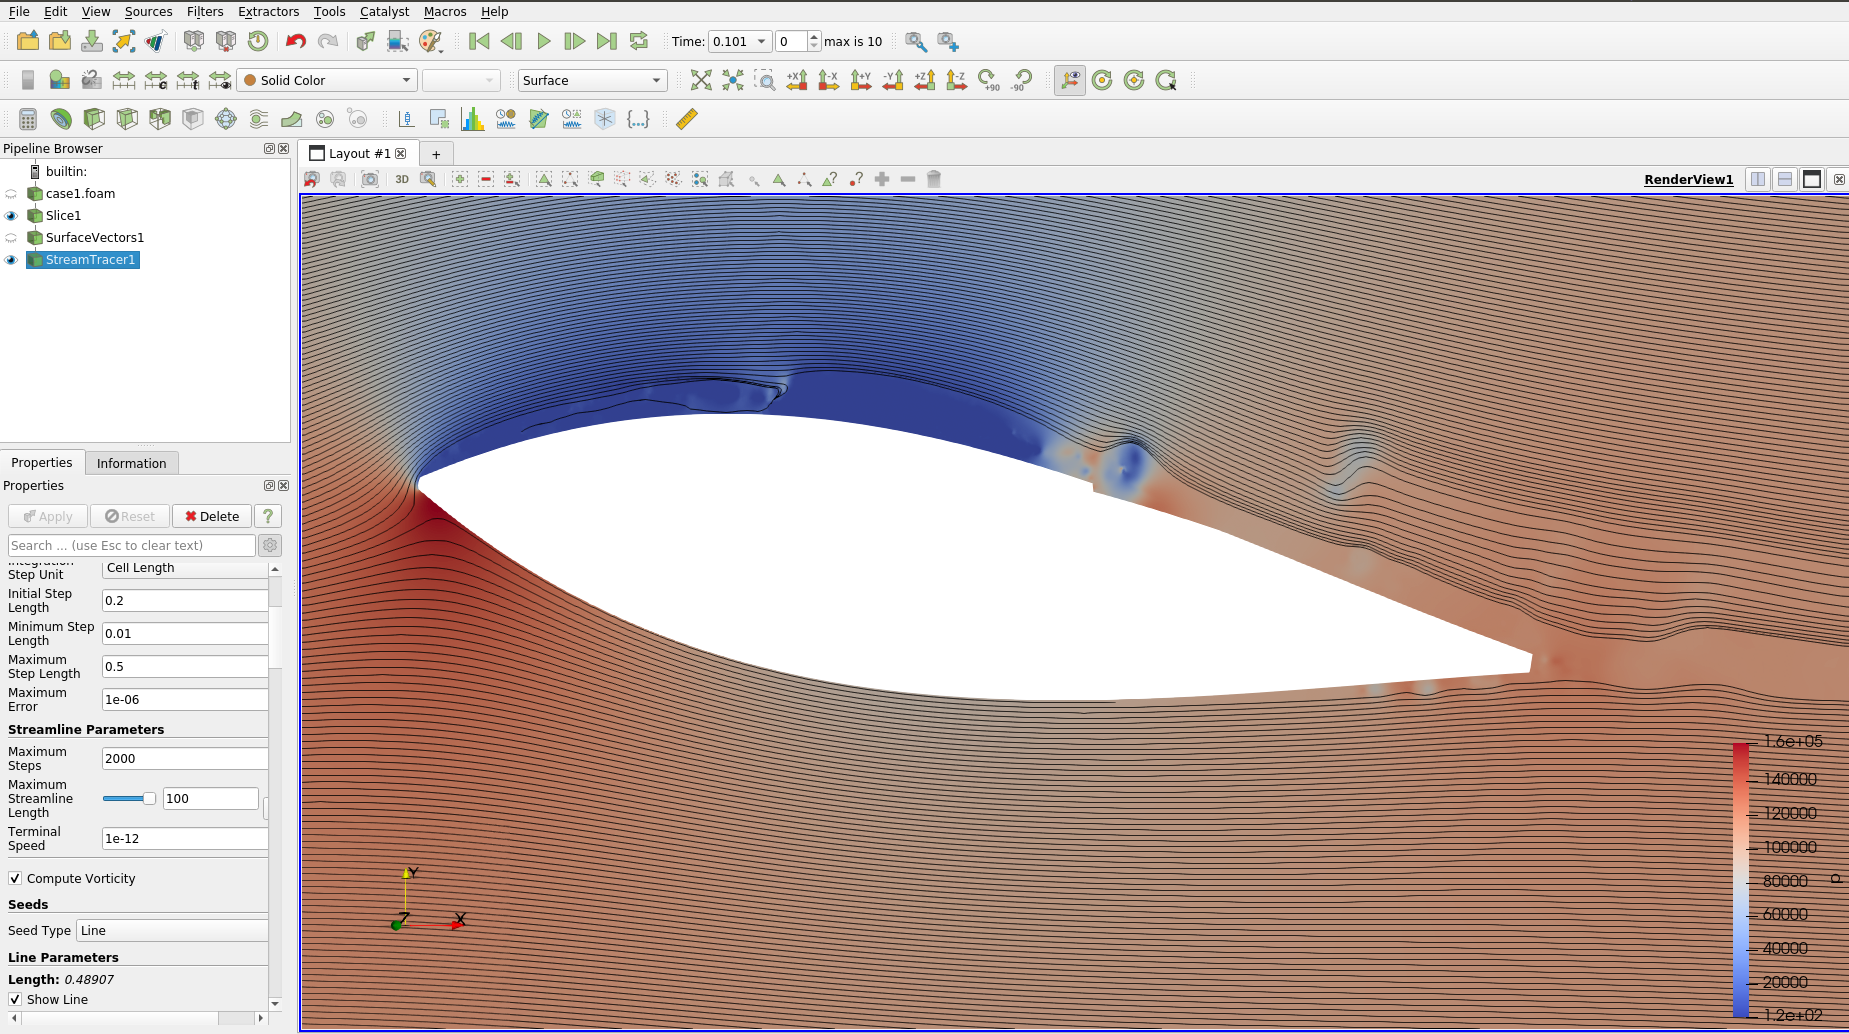
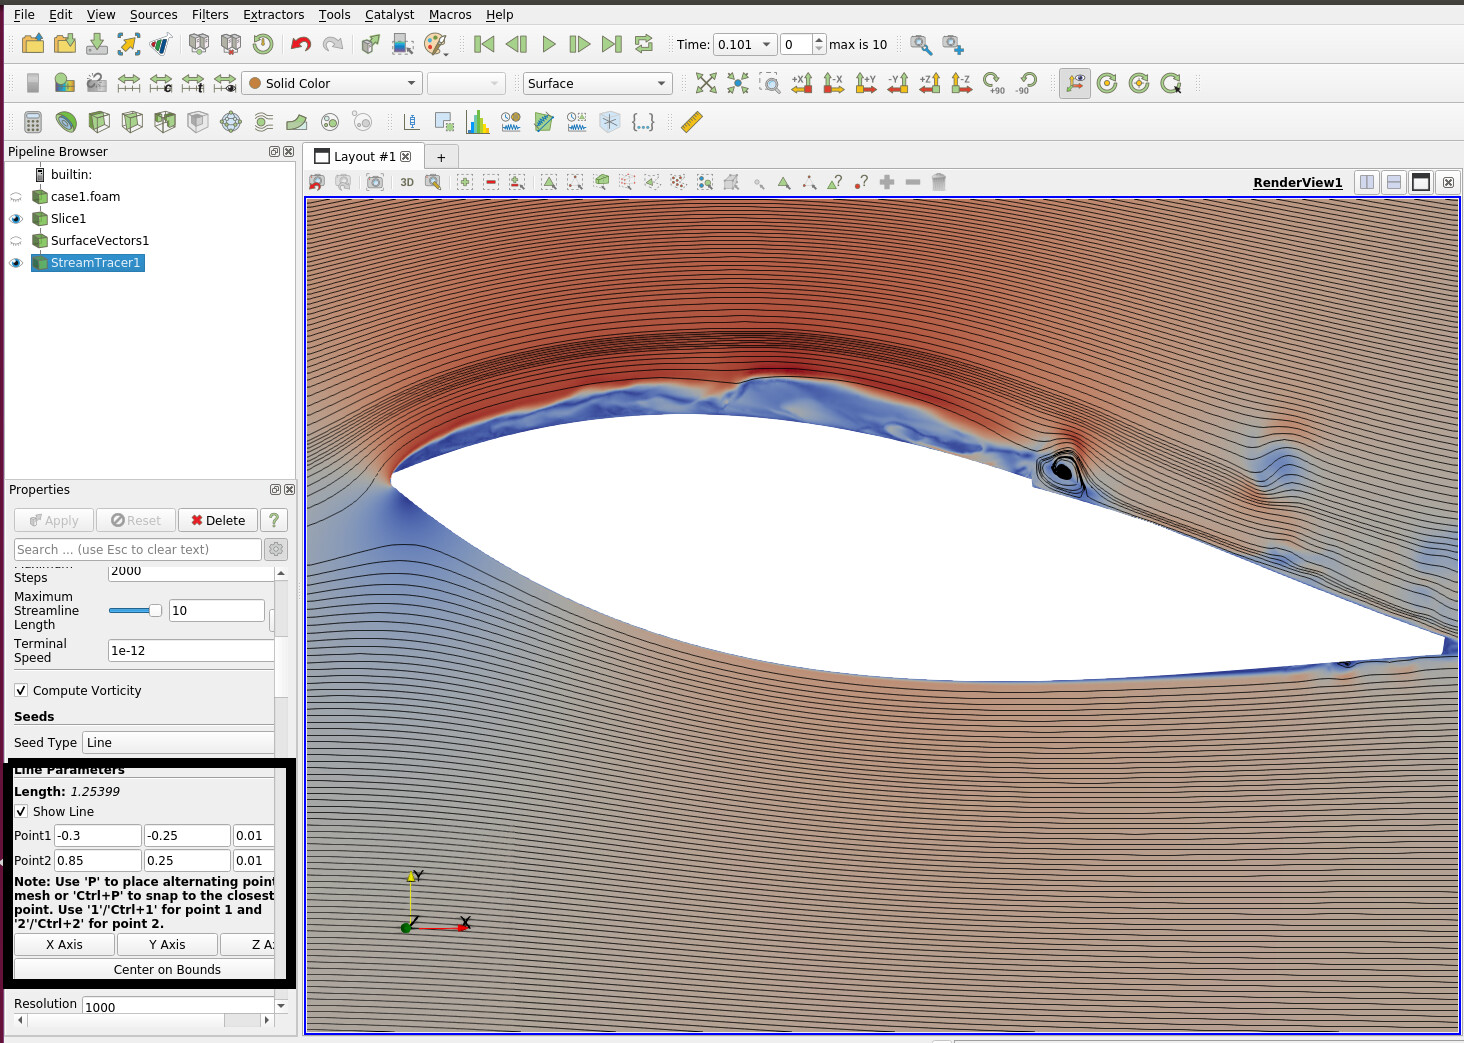
Thanks a lot @mwestphal for your help. It definitely improved but not exactly what it needs to be (I suppose), the screenshot is attached herewith of the figure+pipeline is attached herewith, I am not sure if your are getting the same field of streamline for this case or something else to be done. But I highly appreciate you kind help in this regard.
Thanks again for your help, but don’t you think that the streamlines are ending abruptly in the figure (shown by circle), is that physical, since at that point the tangent at that point will refer to 2 (or may be multiple) directions of the velocity, I think that issue contradicts the fundamental definition of the streamline ? As you can see in the screen shot that I tried to increase the “maximum streamline length” to 100, but haven’t worked for me either. Also I would expect that the streamline would identify all the vortices in the flow. What you suggest/comment. Again I highly appreciate your time and help, thanks again.
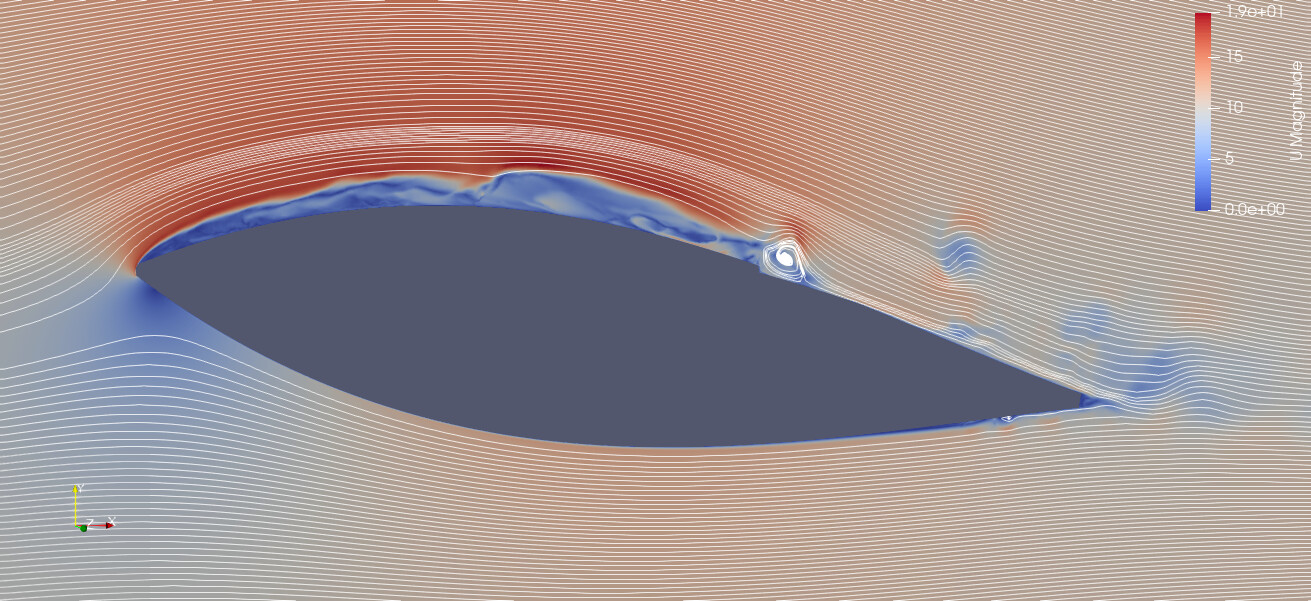
Thanks again. This figure looks (physically) better than my figure, what you say? Could you kindly share the pipeline or may be the *.state file with me either by email or by the forum, whatever is fine with you. Thanks a lot for your help.
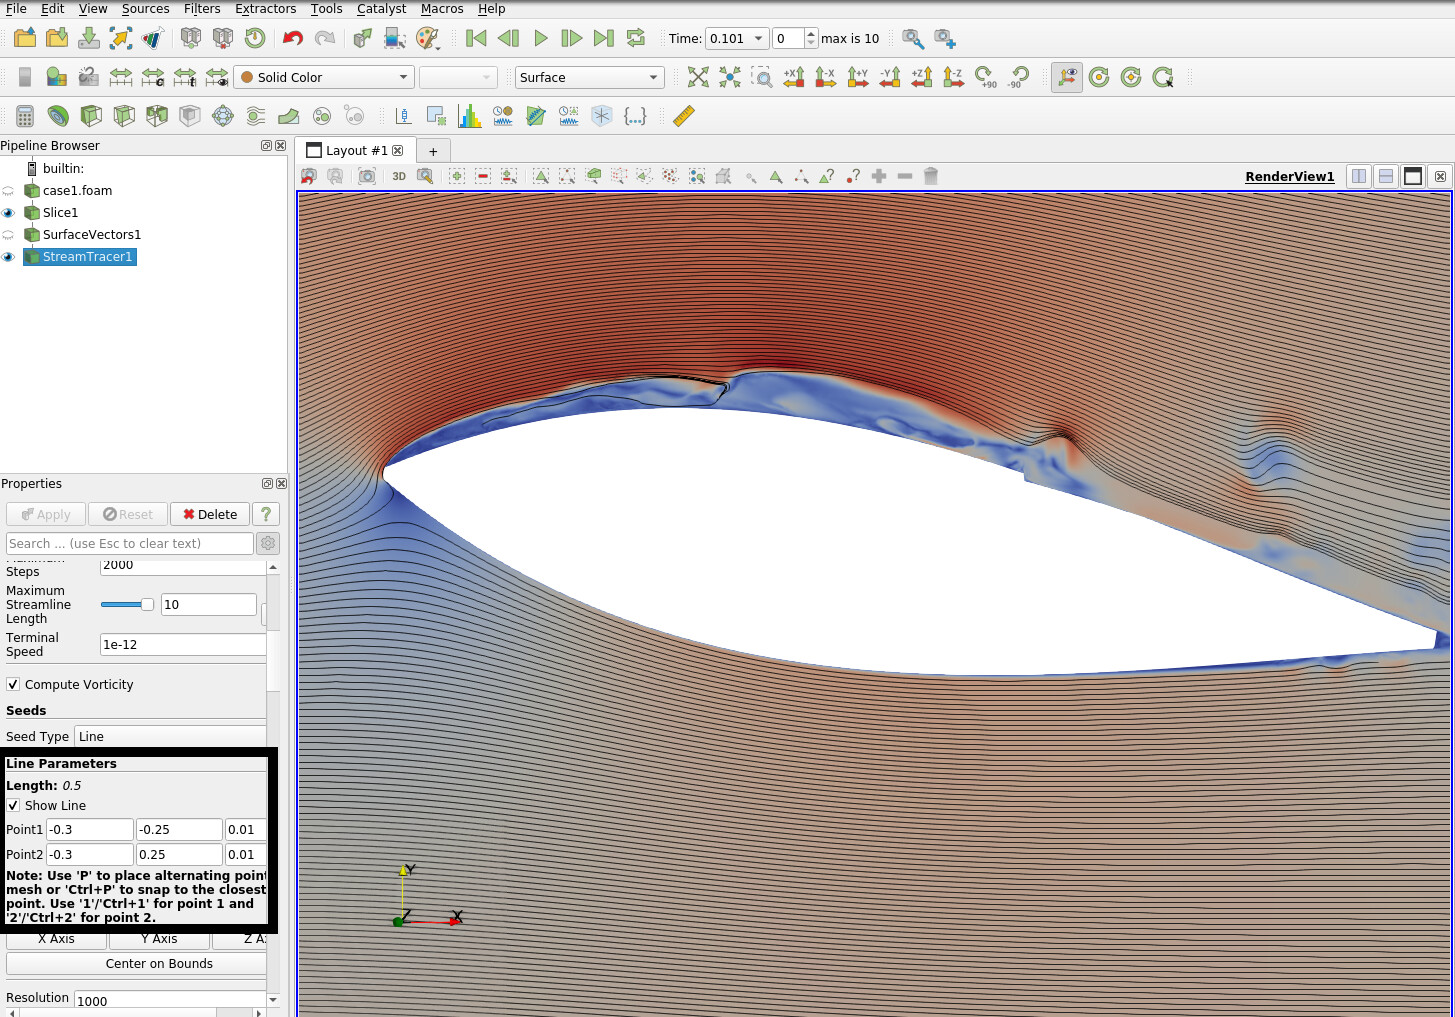
Thanks a lot @mwestphal for your help, I am getting a similar plot as you have shown using your setting but I am surprised that the plot like the attached one if I change the seed type location to inlet of the computational domain. Both the plots looks correct and incorrect both. Now I am really confused, do you have any idea how to proceed further with drawing a “logical” streamlines around the hydrofoil?