No idea what that means.
Sorry for the confusion, I mean to say that out of the above two plots of streamline which you think is correct or more physical, since in both the plots the streamlines are truncated abruptly.
There may be some small computation error due to apporximation that makes the streamline goes out of domain. This require deeper investigation.
Another solution is to use the SurfaceLIC plugin instead of streamlines.
ok, thanks for your clear answer. Could you kindly elaborate or could you suggest some link where this plugin have been used?
Using SurfaceLIC is a fine idea. If you still want to try to dive deeper into why some streamlines got terminated early, you can try to color the streamlines by the field ReasonForTermination, which the streamline filter adds to each stream to report why the stream stopped. Each stream will be assigned a number 1-6. According to the documentation, here is what each number means:
- streamline crosses the exterior boundary of the input dataset
- initialization issue
- computing an unexpected value
- reached the Maximum Streamline Length input value
- reached the Maximum Steps input value
- velocity was lower than the Terminal Speed input value
@Kenneth_Moreland : When working with streamlines on 2d slice, I commonly get outofdomain (1) due to numerical errors, it can be hard to fix. I think this is the issue @proxy is uncountering.
I agree. I have that issue a lot with 2D streamlines, too. If that is the case, @proxy may try turning on the Surface Streamlines option if it is not on already.
But still, there is a chance that the terminated streamlines get caught in a vaccuum where air is moving slowly or not at all. It would be good to know that is what is happening.
SurfaceStreamlines works ok on non-planar surfaces, but is very bad on slice.
It should be reworked !
(I wrote this feature a bit naively some years ago)
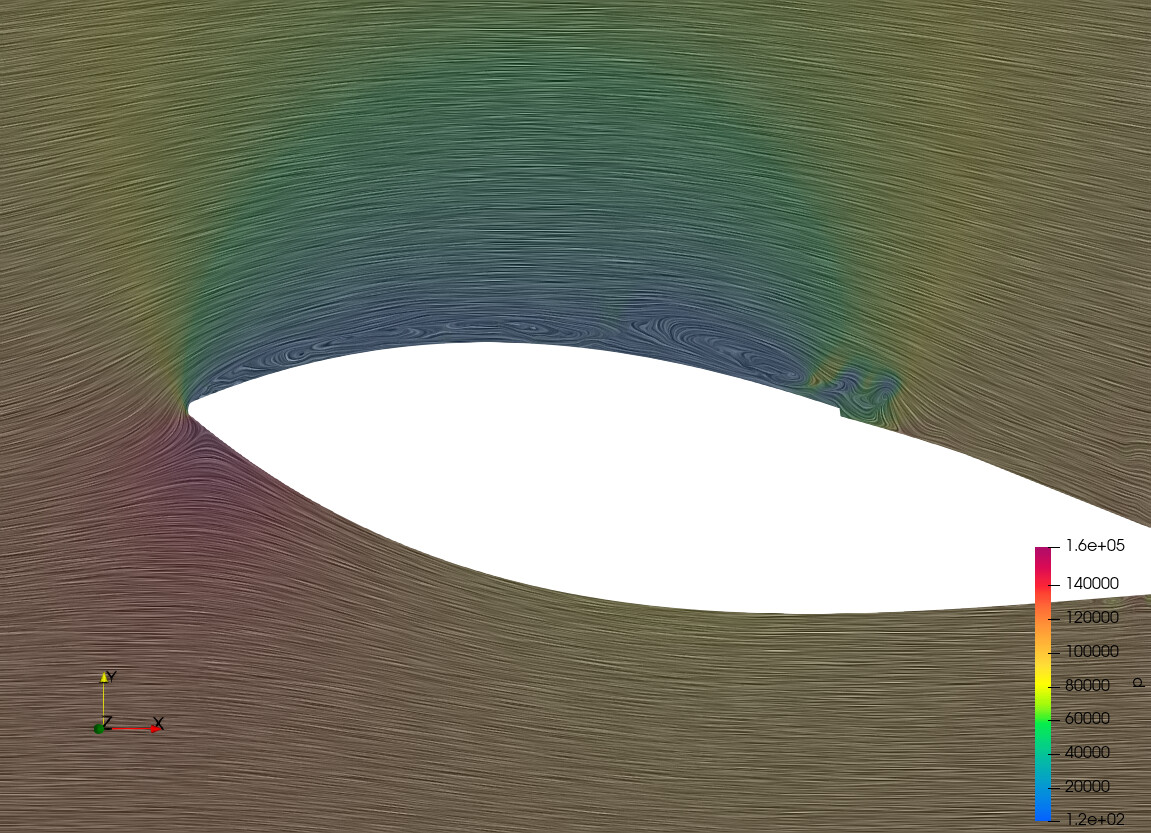
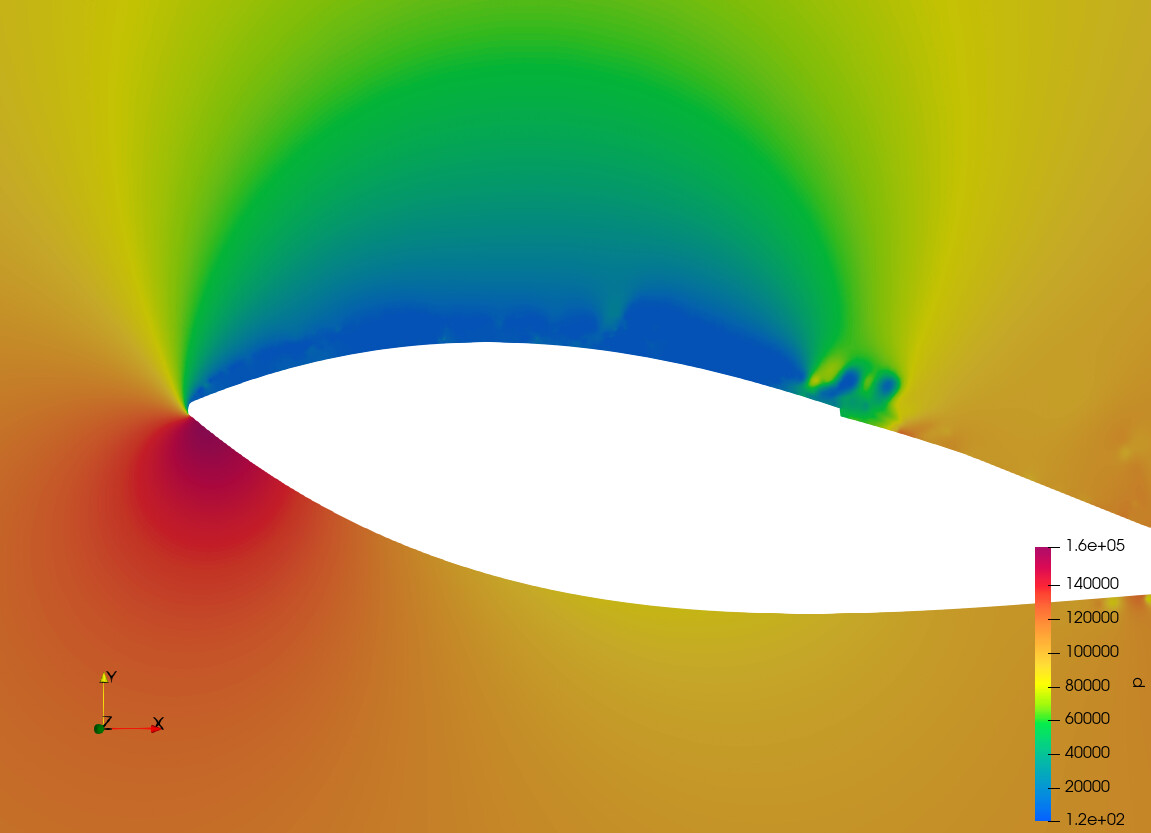
Using your help @mwestphal and @Kenneth_Moreland I tried to create a surface LIC plot, which is attached herewith, it is definitely giving a very clear idea about the flow (attached herewith). But I wanted a plot in which a contour plot of pressure is there along with the flow dynamics (streamlines etc).
This may help you as well:
Thanks for your efforts, but since the mesh is un-structured so actually its not helping me…