A couple of months ago I was discussing with customers for the first time about a possible “point labels” feature. The idea is to have text labels “attached” to the points of a dataset, like it is possible to attach glyphs, but “2d” of course so they are always readable.
I was told that there is a chance that such a feature would be somehow realized in version 5.7 - and now I wonder if it is the case, and if yes: where is it? So far I could not find it in the RC2!
After a first look into PV 5.8, I tried to find such a feature, but did not see anything so far! For some of my customers it would be rather important, so I consider doing it myself somehow if it is not coming from Kitware. The point is that these people want to display exploration drill holes - which works quite nicely -, but they normally have some label, and this would be an interesting piece of information to see on the screen - and not only if the “collar” points are selected!
One point is also the fact that selections would not go into state files, so any labelling would not be reproduced if users are opening “the same thing” the next day again.
Questions:
a) Is such a label display option maybe indeed in 5.8 - and I was only too blind to see it?
b) Or else, are there any ideas or concepts about how to realize such a thing which I could follow if I find time myself?
I assume that I would have to generate some “transparent panels” on which to write the labels, and then make sure they only have an origin in 3d, while otherwise being somehow 2d and always oriented towards the camera.
The whole thing could be a filter, like the “Glyph” filter, or else some display attribute like the colors etc.
These are the things that I would like to hear/read from people who have already thought about a possible implementation!
Have a look at the ParaView 5.8 release notes under the section " New Billboard and Flagpole mode for Text source". I think that describes what you want.
With that information I think I am ready to explore further and find out how I can apply that to our exploration drill holes: Maybe I just need a little update also for the “sampling reader” that I wrote for them which reads samples or drillhole data from one or three standardized CSV files and displays them either as sequence of line segments or else “decorated” with a “tube” to give them some volume…
The most important pieces of information are thus: “the feature exists” and “billboard is the name of it”…
Now my custom application is ported to PV5.8 (and it was definitely much easier than the step from PV5.6 to PV5.7!) so it is time to try a realization of “drillhole labelling” with the new “billboard” feature.
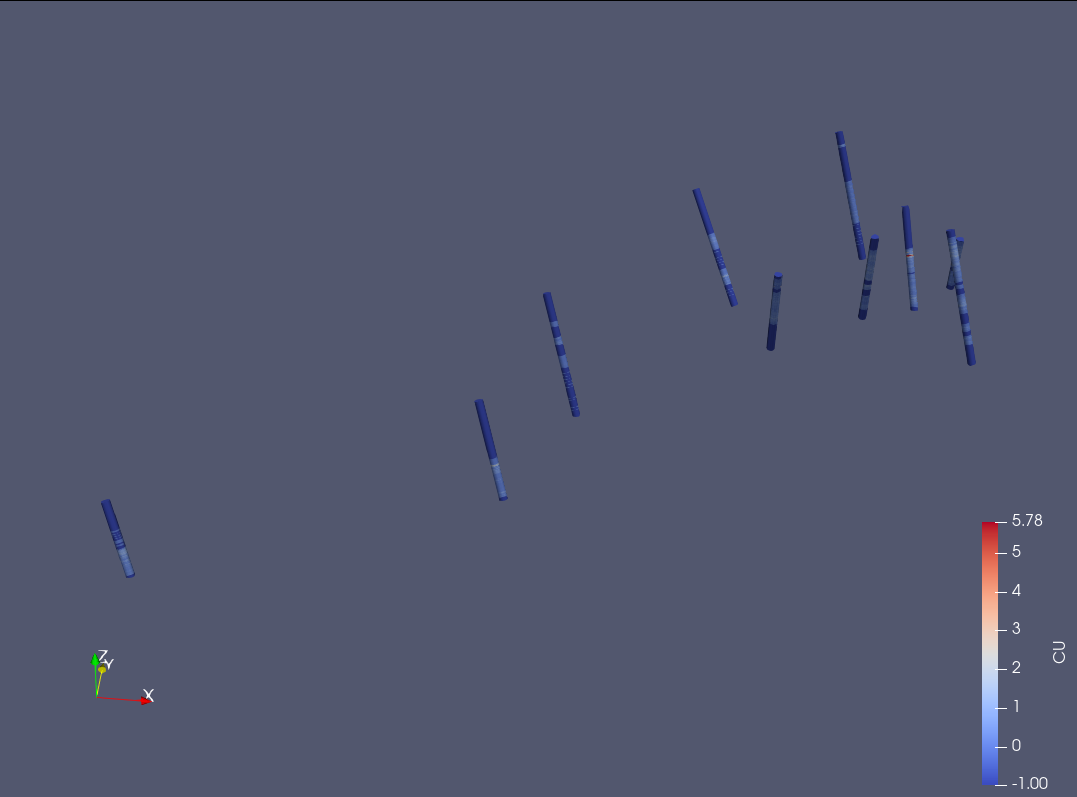
So far I have a “sampling reader” that reads single samples or entire drillhole data sets from CSV files and displays them either as points/lines or with some “decoration” (sphere etc. for samples, “tube” for drillholes). It generates display like this example is showing:
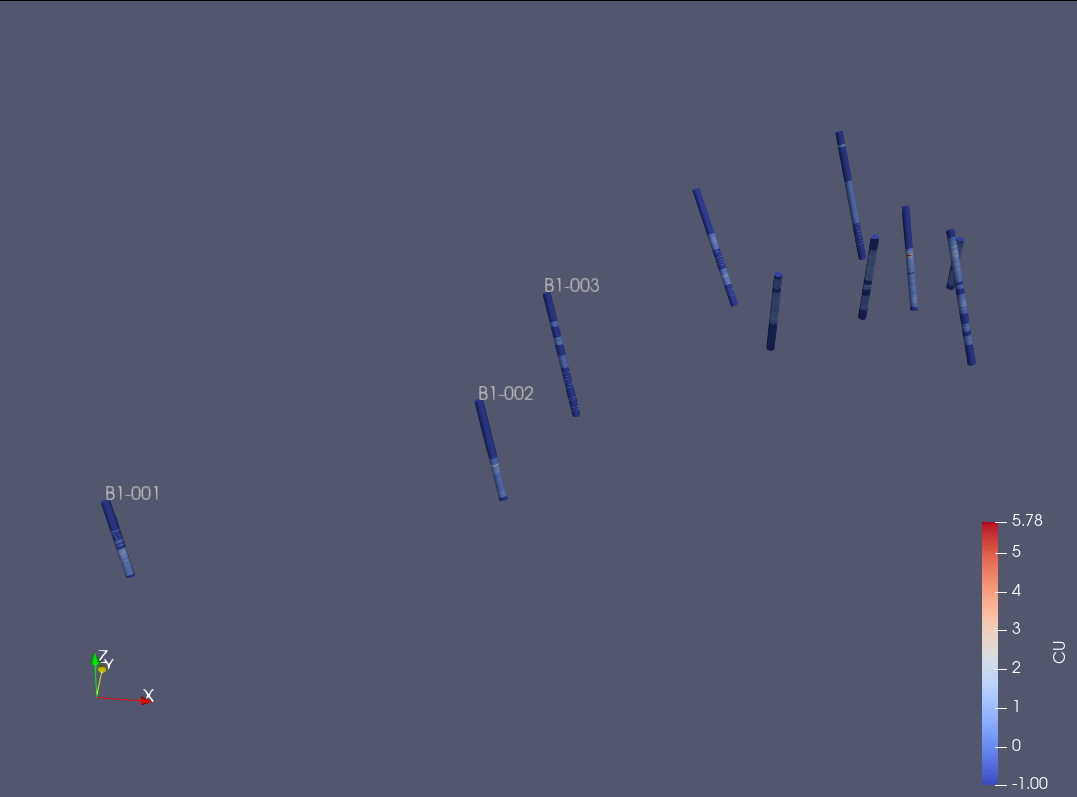
If people see these drillholes in space (of course with some other informative display around), they normally expect to see also the drillhole labels. This can now indeed be achieved with the “billboard” mode:
However, generating this is tedious for 10 drillholes (so I did it for 3 only) - not even think of doing it with a full data set with possibly hundreds of holes! Because each one of the labels means:
from “Sources” - “Annotations” generate a “Text” and enter the label.
then go to the “Display” properties, switch to the “billboard” display and “attach” the label to the right drillhole.
The “sampling reader” already generates the graphic objects to display the drillholes with “tubes” and all the attributes.
In the same way I would like it to generate also all the “Text” objects, but make sure they are displayed as “billboards” in the right place from the beginning. All the many “Text” objects should appear as only one in the pipeline, so they can be simultaneously switched on or off.
If this is possible at all!?
Or would I have to generate “3D Text” objects? But the “always-look-to-the-camera feature” of the “Text” objects is of course much better because it is readable no matter how the user wants to rotate the model.
I’ve created a new Representation via an XML file (no code) that I load as a plugin in PV 5.8
I’ve created a filter ExtractTopHoleFilter using the python plugin infrastructure.
That way, by loading a Python and an XML file as plugins, I was able to do exactly what you are trying to achieve.
For reference here is the XML part, for the filter, I’m sure you can figure it out.
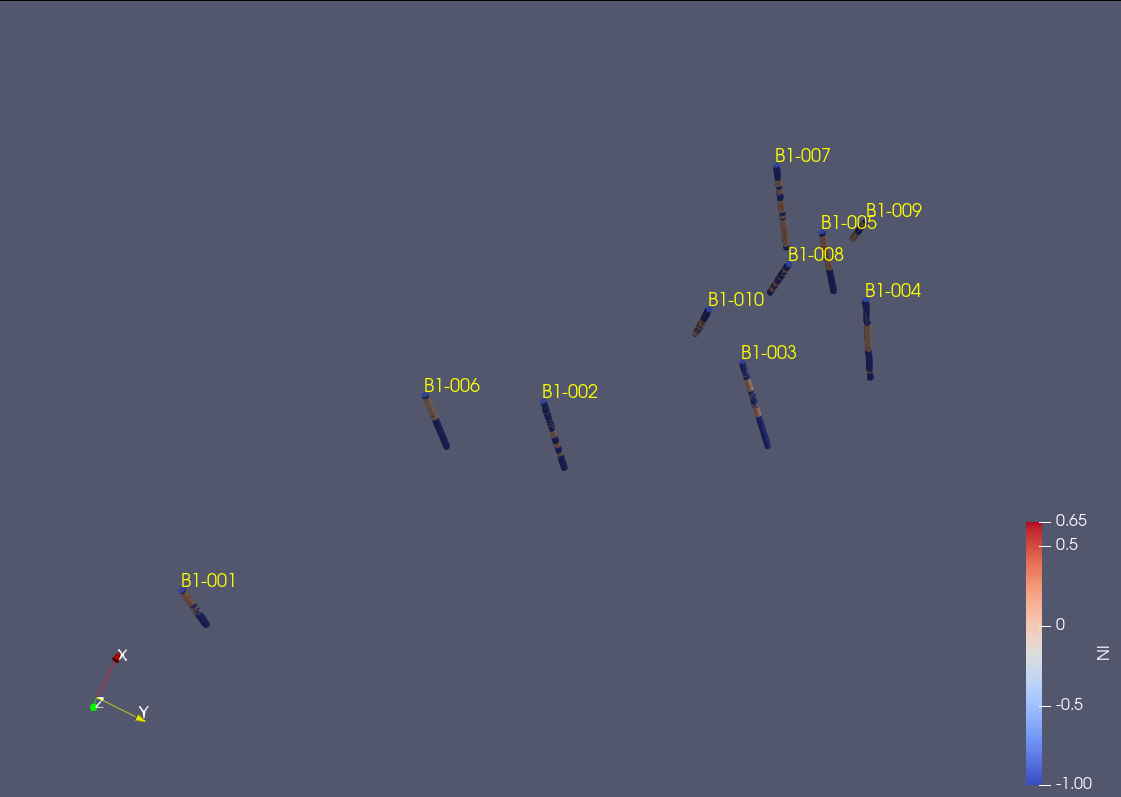
Actually I prepared two input files: one with the drillholes, and one with only the top points plus labels, and I loaded them as two “pipeline objects”. The second, which is the labelled points, is shown with the “Label” plugin that you provided - thanks again!
I only still had to choose the proper label attribute and turn on the label viewing.
Next will be: extending my sampling reader in such a way that it directly generates two “pipeline objects” like the above. And somehow I would like to manage that the Label display automatically “knows” the correct attribute, and turn the label display on.
(Could I possily achieve the latter with some “Hint” in the reader’s xml - telling not only that “Label” should be the default representation, but also the properties “PointFieldDataArrayName” and “PointLabelVisibility”? Or else I may have to write a little additional CXX for the Label representation that takes care of this? Let’s try…)
Users can then simply toggle on/off the label display in the pipeline, and only if they want to change the display properties they have to go to the Display panel and adapt whatever they like.
Things are going well - and I am even starting to understand what I am doing with the above method: I was not aware of the fact that a representation class “DataLabelRepresentation” already exists in the code that only needs to be subclassed!
But for the programmatic finetuning, I am still struggling with the question of how to automatically choose the proper labelling attribute and some other attributes, like “label visibility”.
One way I can imagine is to simply write an alternative XML that uses the existing vtkDataLabelRepresentation class code and only provide different “default_value” entries in that XML. But it feels somehow weird: Isn’t there possibly a way to replace the “default_value” directly also in a derived XML like the one that Sébastien was providing?
Of course this is only ok if a default value is already available in advance, like setting label visibility to always “on” instead of “off”. However, for the automatic selection of a proper label I would like to have some kind of automatic choice in the following way:
if “HoleId” does exist as an attribute in the input - take it.
if instead “SampleId” does exist, that’s fine as well
if just a generic “Name” or “Label” attribute exists, this would be the third choice
only if none is available, do it with “empty” like it is the default in the “standard” data label representation (together with label visibility off)
Just to report back: Everything is working fine now!
There is a “sampling reader” that generates two output items:
a polydata object that can be either points (single samples) or polylines (drillholes), or the same with “decoration” (option), so they become things like spheres and tubes
another polydata object that consists of a set of points with a point attribute “Labels”
Then there is a “Labels” representation that is built like proposed by Sébastien (above), but in order to also change the defaults, I added (duplicated) the XML code of the “DataLabelRepresentation” in order to make point labels visible by default, and choose the “Labels” attribute by default.
Finally, with “Hints” I managed to get the first data item output to be displayed with the “Surface” representation, while the second is displayed with that new “Labels” representation.
Little open question: I duplicated and adapted now the entire XML code of the DataLabelRepresentation because I did not find a way to do the same thing without full duplication, like: “take everything from DataLabelRepresentation, but change these two default values…”. Anyway, would be somehow “more elegant”, but my solution is working - and that is the most important thing!
And once again: Thank you Sébastien for your support!
Thank you so much Sebastien. I had been looking for this since I started using PV. I wanted to label borehole numbers from borehole collar data just by loading a csv file and assigning the XYZ and label columns. I had even tried python scripting but to no avail. Found this discussion today and I simply copied your code into an xml file and loaded it as a plugin. Then I was able to select the new representation “Labels” under Display of Properties tab. It gives an error when you have labels in first column of the data but otherwise works well. Color selection could be improved with option to choose color from a grid rather than RGB values but still this is more than enough for me. Thank you once again! Kudos to Cornelis as well !