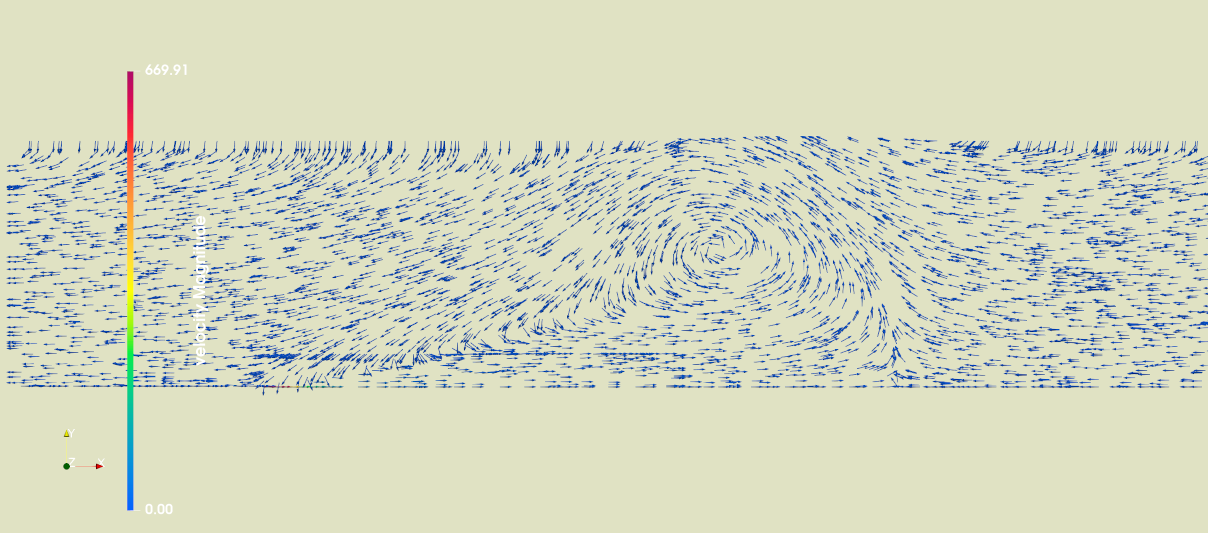
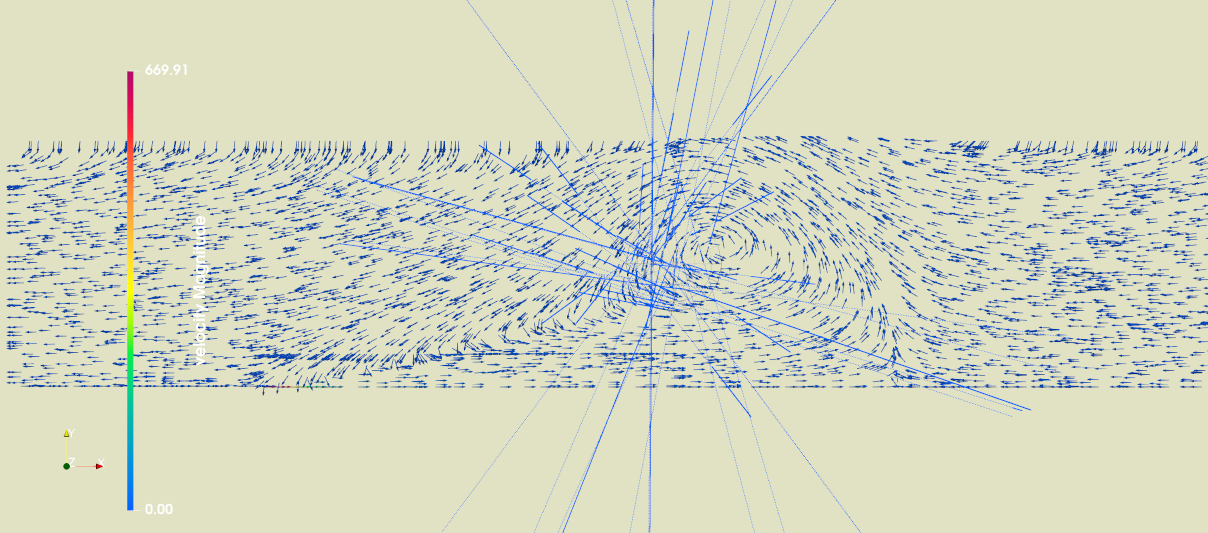
I have a 2D axisymmetric model of a very small jet coming into a stagnant domain. The solution has been loaded in Paraview and I got a good plot with the vector fields. But when I try to add streamlines nothing seems to work. I have tried line source and sphere source all over the place: putting the line across the small inlet at the bottom of the domain, putting the sphere by the inlet, putting the sphere near the center of the re-circulation zone, adding to the number of points, etc. These images show the sphere source with 10,000 points overlayed on the vector field, and the streamlines make no sense to me. I always seem to get just a bunch of straight lines no matter how many settings I try or where I put the sphere or line source.
Since lots have looked but nobody has offered any advice, I’ll ask:
What can I do to promote a response? Should I upload case files and share them? Are details missing from my description? How can I help others to help me?