Hi to the forum,
I’m new with Paraview, but I’m using Nastran for over 30 years. Now a client asked me to show him the loeadpathes in a mechanical problem. These data will not be shown in nastran directly. Only over the MajPrin Stress you can get a feeling about the loadpathes.
I decided to use Paraview and saw that with Nastran (.nas and .f06) there are some problems. Well, the geometry data (.nas) could be read and for the Stresses I made an .csv file. (Attachment)! Worked fine. PV20199126_B01|690x430
Can somebody tell me where to read about how to combine the result data with the geometry? Maybe I overlooked somsthing in the tutorial. Or can someone give some short tipps?
Thank you in advance. Kind Regards. Harald.
Can you share a samples for the .nas and .csv files? that’ll make it easier.
Are the stresses in .csv associated with the nodes in the geometry and specified in the same order as the nodes in the geometry? In that case, a Python programmable filter that simply combines the arrays may do the trick. If you a sample dataset, I can put together state file.
Hi Utkarsh,
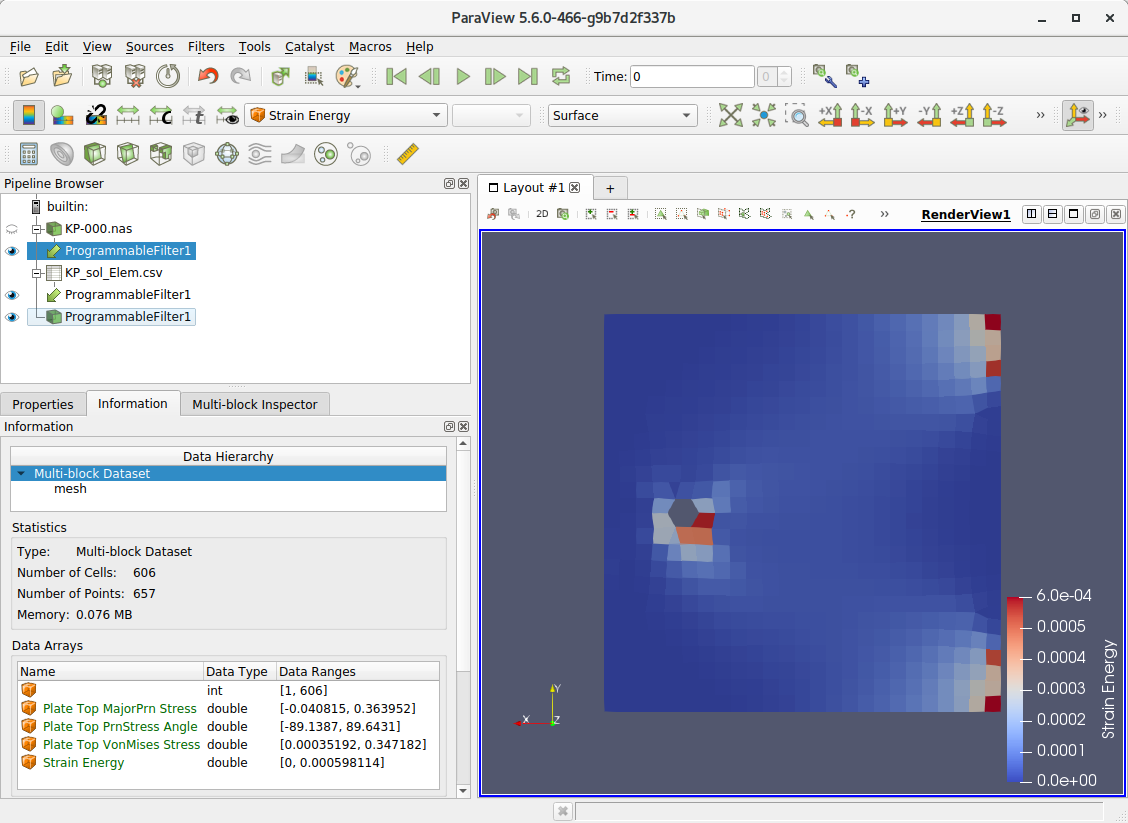
thank you for the answer. Yes the .nas file holds the Grid Points and the Elements(Cells) and the .csv contains the Stresses(,“Plate Top MajorPrn Stress”,“Plate Top PrnStress Angle”,“Plate Top VonMises Stress”,“Strain Energy”).
KP_sol_Elem.csv (30 KB)
KP-000.nas (83.0 KB)
This are the files I worked with. If I would know how to make the association it would be fine.
Thank you in advance.
Harald,
Here is the state file merge_arrays_state.pvsm (251.2 KB)
Here’s what I did, I opened the two files then selected the .nas and .csv readers in the pipeline browser and then created the Programmable Filter with the following script:
blk0 = output.GetBlock(0)
tbl = inputs[1]
blk0.GetCellData().PassData(tbl.GetRowData().VTKObject)
The result is that all the arrays from the csv are now available on the cells.
Hi Utkarsh.
it works fine. Thank you.
Is there a source to read about these hacks? Or do need the whole python skills? For me visualisation is not that big deal, I need it only once or twice the year. On the other hand, it would be nich to read nastran files. OK, the .nas file is possible to be read, but the .f06. Maybe it is possible to read the /export/analysResults/asCSV. This file is simple.
Have a nice day.
Have a nice day
I’m also new with Paraview, and have the same situation.
But in my case, the csv file is not of cell data but of grid point data so that I’ve got the AttributeError.
I guess the third sentence, ‘blk0.GetCellData().’ should be changed.
But I have no idea. Could you help me ?
I would greatly appreciate if you give me some tipps.
Kinds regards, Makoto
please create your own topic and share your dataset.
Hello Utkarsh,
In the above example , elemental results are there in csv file.
Can I use the same way to get nodal results?
Will the mentioned script(copied below) work to get nodal results?
blk0 = output.GetBlock(0)
tbl = inputs[1]
blk0.GetCellData().PassData(tbl.GetRowData().VTKObject)
Thanks in advance
Hello Makoto,
Did you find any way to append grid point data?
if yes, kindly describe here.
Thanks in advance
For nodal/point-centered data, you’ll need to modify the script as follows:
blk0 = output.GetBlock(0)
tbl = inputs[1]
blk0.GetPointData().PassData(tbl.GetRowData().VTKObject)
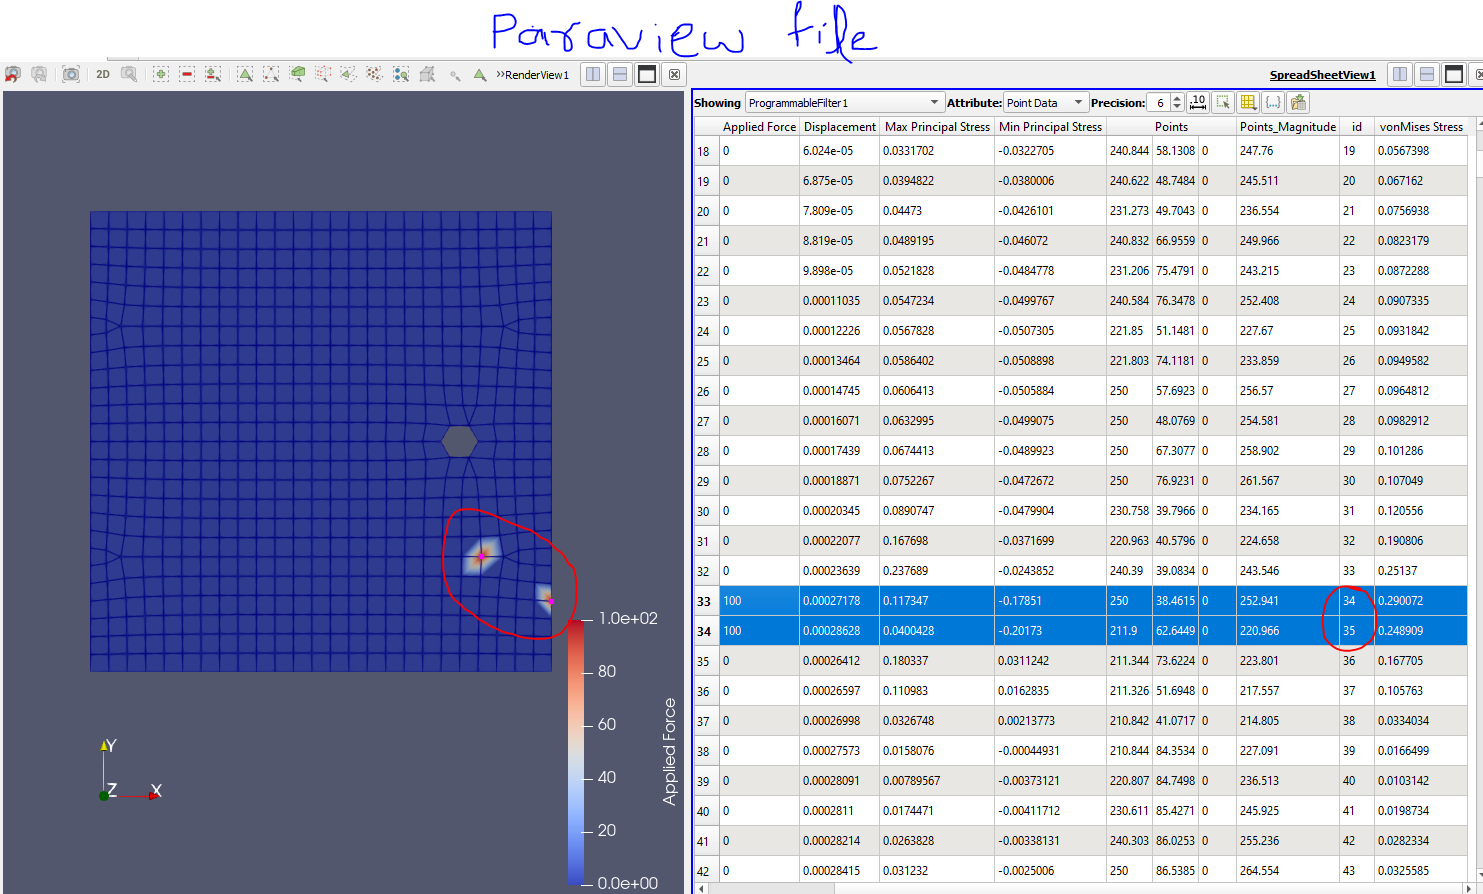
I don’t think the order of points in the input mesh and the CSV is same, as you’re expecting it to be. If so, the approach mentioned won’t work. Please attach the original datasets if you can reproduce the issue and perhaps there’s another approach that may work.
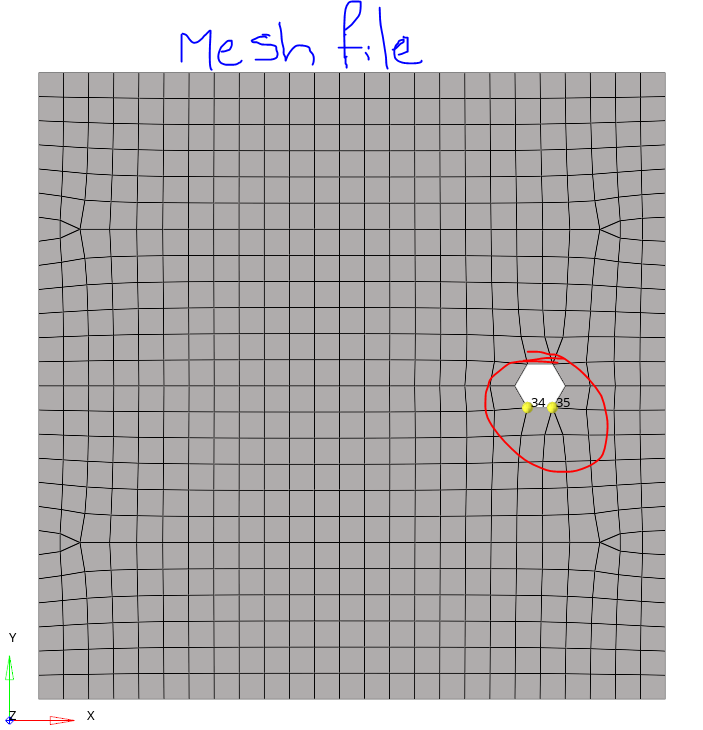
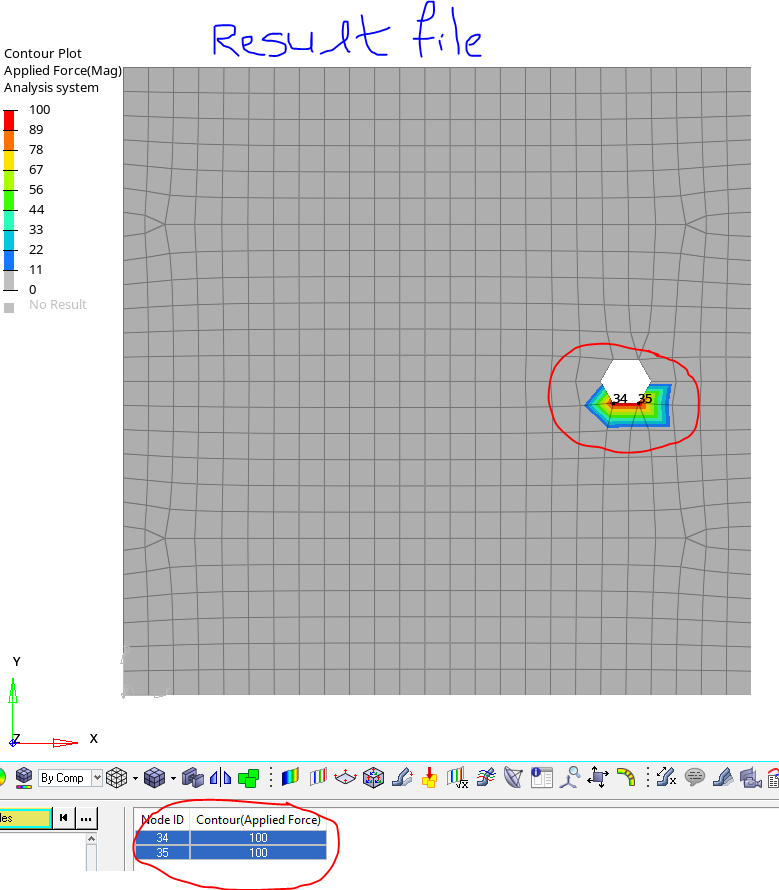
Node numbers in Mesh files are random but in CSV file it is in incremental order (1-657).
Please find the attached files for your reference.
208431_Plate_Nastran_290922.csv (33.0 KB)
208431_Plate_Nastran.nas (74.0 KB)
There’s no information it he files you attached, alas, that lets one map a node in the mesh to its “id” in the CSV and hence there’s no way that I think of to make this work. Note, there’s no such thing as a canonical sequential order for iterating the nodes in the mesh. If can be programmatically defined, then one can write some Python code to use that to map rows from CSV to a node correctly.
Dear Utkarsh,
When I select both files, Programmable filter button is not active for click on. Do you know what could be the problem?
thank you in advance!
Not sure. Perhaps you have not hit apply yet after opening one or both of the files? Maybe pasting a screenshot will clarify things.