Hi
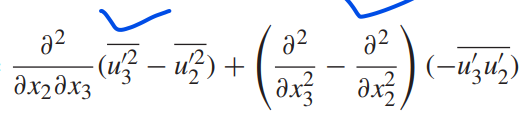
I want to calculate single and double derivative of different variable and add them together to get the result. How can i do it in paraview? I have attached the picture of the expression i need to calculate. Can i use any filter, etc.or define the gradient in a particular direction? any help is appreciated. thanks
Hey any idea on this?
By applying the Gradient filter twice to a single scalar variable, you can obtain the Hessian matrix. Utilizing its elements should allow you to perform the desired calculations. However, since first-order numerical differentiation is performed twice, caution may be required regarding potential loss of accuracy.
Hi
thanks, It has created a 9 sets of new variables of double derivative, then i want to form a variable with sum of those. But when i am using a calculator to create the sum how should i call them? like gradient_7 is not working nor gradient 7. Can you give some idea?
You may need to enclose it in double quotation marks, like “gradient_7”.
No its not working-can i share my state?
is working if i define under the variable, but i want to take different item from the 9 derivatives and sum them. So what should be the input filter to that calculator? like i took second derivative of 2 different variables and want to sum different items for both of them. SO shoud i define them one by one or give the input filter to the main .encas file?
I am not entirely sure if I understand your question correctly, but if you want to include second-order derivatives of two different variables in a single dataset, you can apply the Gradient filter twice in succession to each variable. As an example, I am attaching a state file
hess.pvsm (966.9 KB)
Hi ky
I have done double derivative, but when i am plotting the contour plot due to some reason the contours are showing along the mesh line. Means the effect of the mesh is visible on the contour plots. Do you know how to get rid of this?
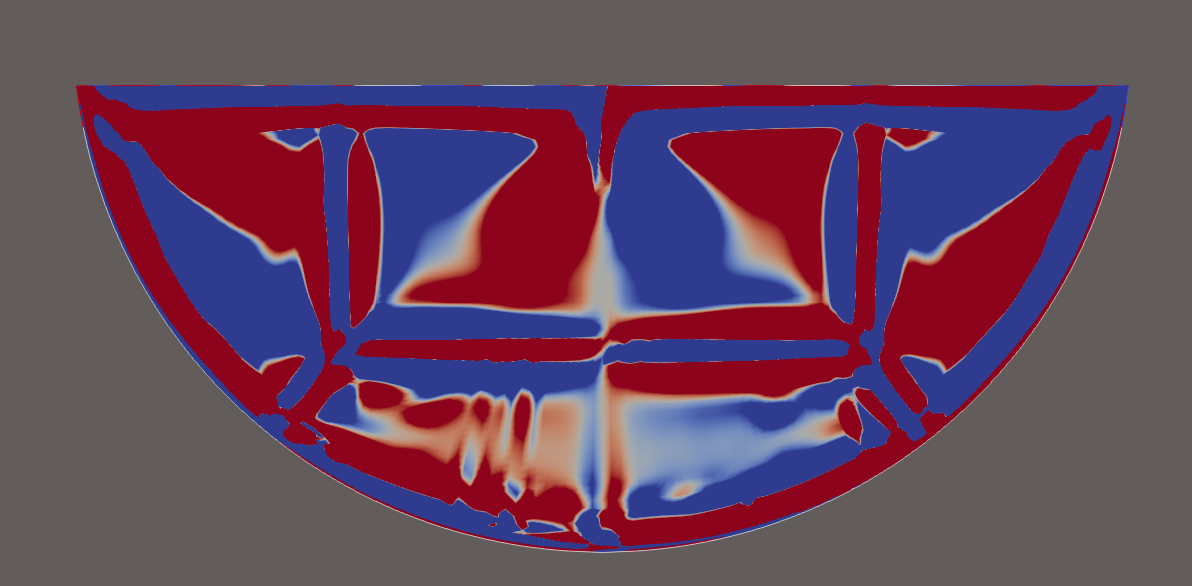
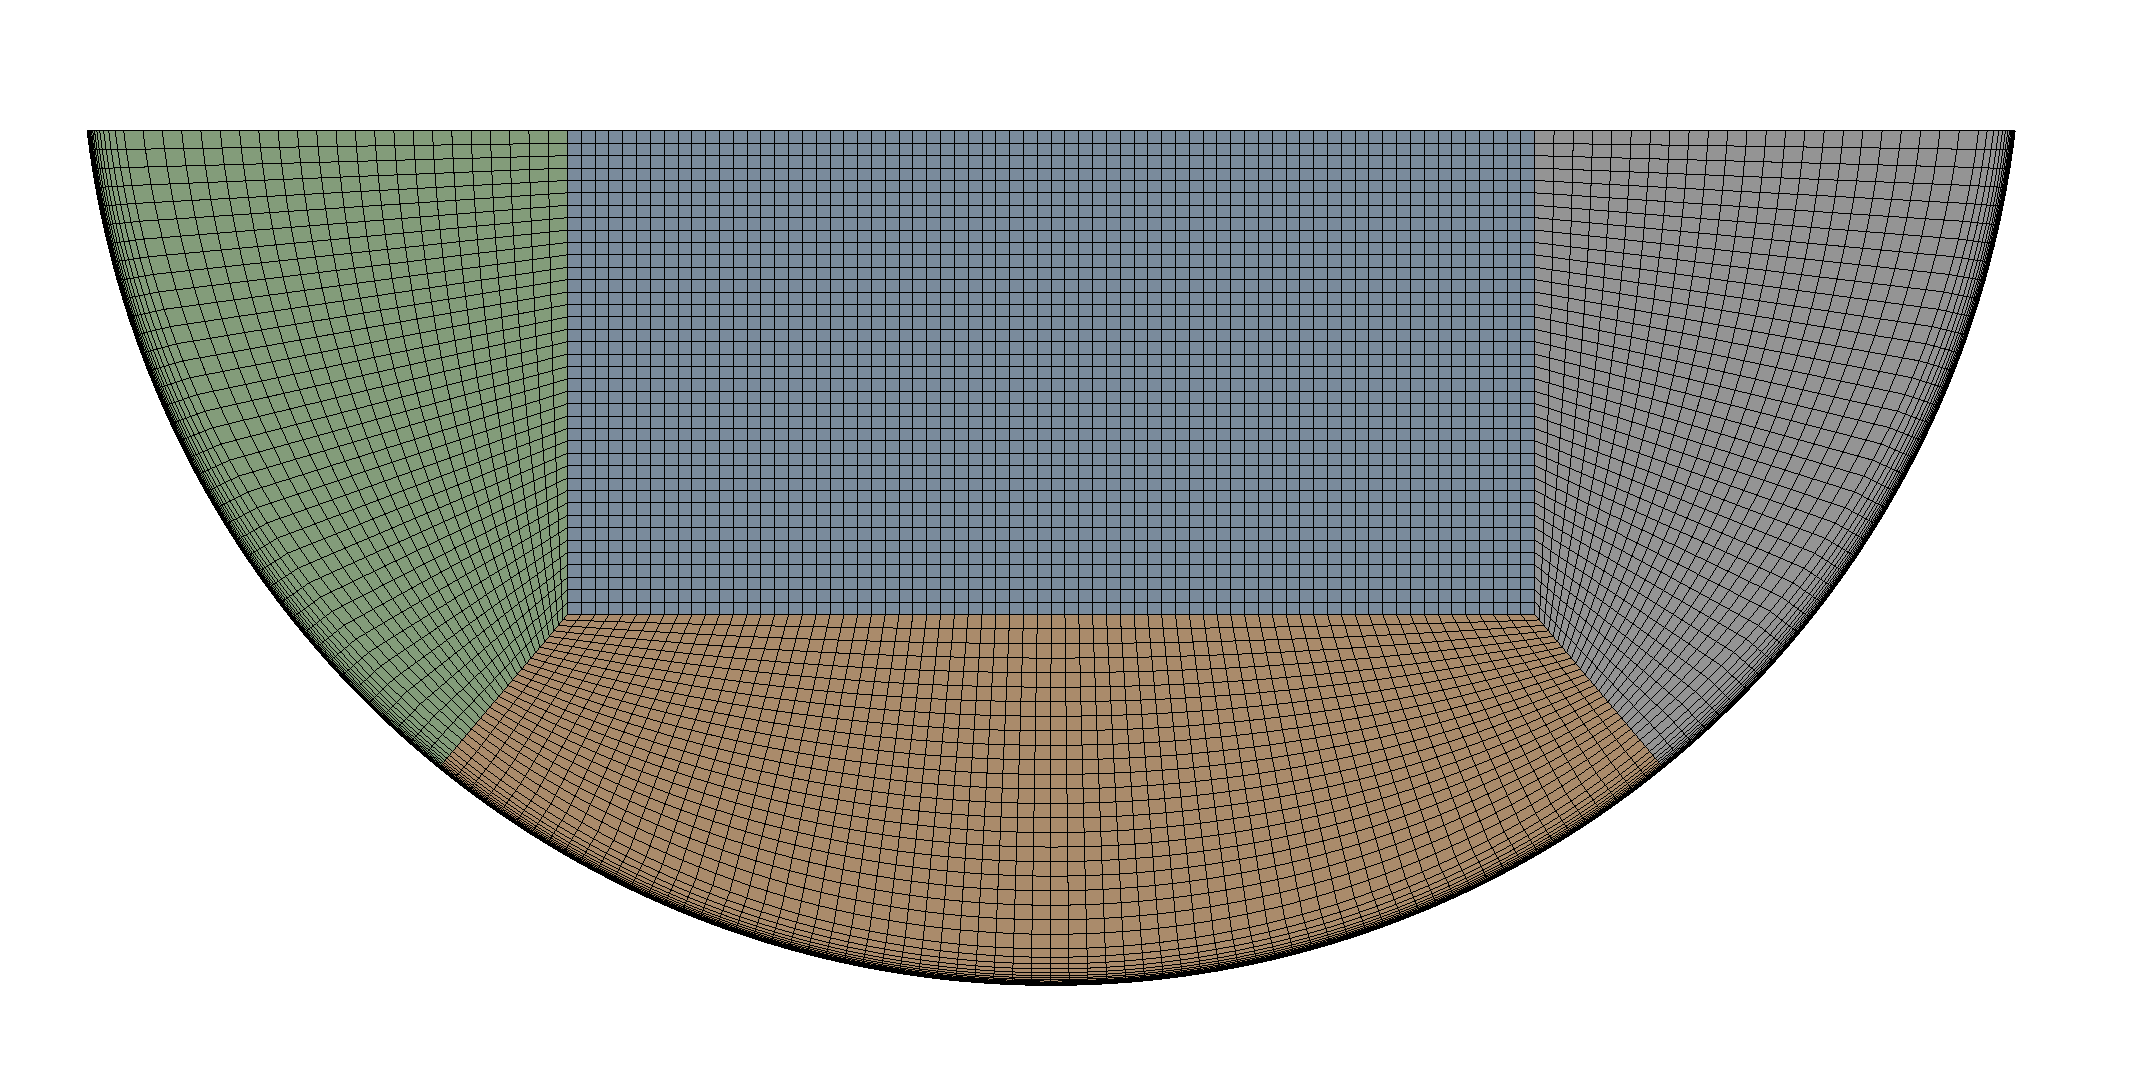
Does the Fluent mesh in this case share the nodes of adjacent cells? If interface boundaries are used, the nodes are not shared, which may result in discontinuities in the differentiation results. Is it possible to display a picture showing the mesh lines?
As I also wrote in my first post, performing a first-order accurate numerical differentiation twice might cause issues with accuracy. Especially in areas like the boundaries of an O-Grid, this decrease in accuracy will likely be significant. There might not be an implementation of higher-order accurate numerical differentiation within ParaView.
Okay-thanks. What other ways can I do the second derivative contour plot? In Matlab or something?
Also if i do extract cells or extract surface, will the artefacts go away? Or is it common with second derivatives? Many thanks
The function for calculating gradients in the VMTK library at the link below appears to perform differentiation with high-order accuracy. I haven’t tried it myself, but it might be worth a try.
Thanks-i will have a look,
Do you have ghost cells in your mesh at the block boundaries? To compute second derivatives, you’ll need at least two layers of ghosts at each block boundary to ensure continuity. Otherwise, you’ll definitely get artifacts at block boundaries.
Here are some potential checkpoints for this analysis:
- Since ParaView doesn’t have a second derivative function, the Hessian matrix is calculated by applying the first-order accurate gradient (Gradient Filter) twice.
- Because it’s a first-order accurate gradient, it will be constant within a cell. However, the Gradient Filter maintains continuity by taking the average of the gradient values of the cells sharing a point as the derivative value at that point. Nevertheless, a loss of accuracy is likely unavoidable when applying such a derivative twice.
- It’s currently unclear if the observed artifacts are a result of applying the first-order accurate gradient twice. We need to check if using a higher-order accurate derivative from VMTK improves the situation.
Other Concerns:
- Has cell data been converted to point data? (It’s advisable to enable this conversion in the Fluent to EnSight format export options.)
- Has the issue of internal boundaries being outputted been resolved? (See: https://discourse.paraview.org/t/fluent-dat-file-export-on-gold-ensight-paraview-format-creating-mesh-lines/16500)
- Was the Gradient Filter applied before cutting the tube?
- Are there any ghost cell issues? (Given that parallel visualization doesn’t appear to be used, this is likely not an issue.)
- Are there multiple blocks? If so, applying the Merge Blocks filter first might lead to improvements.
Hi Kyoshimi
Many thanks. Yes point data is plotted, Gradient filter is applied on a slice from the 3D pipe, I have not added any ghost cells, no there is a single block.
About the ghost cells, according to the post above by Sean, i may need to add layer of ghost cells but i am not familiar with that atm. But will try asap. Do you have any comments? thanks again