Dear Paraview developers,
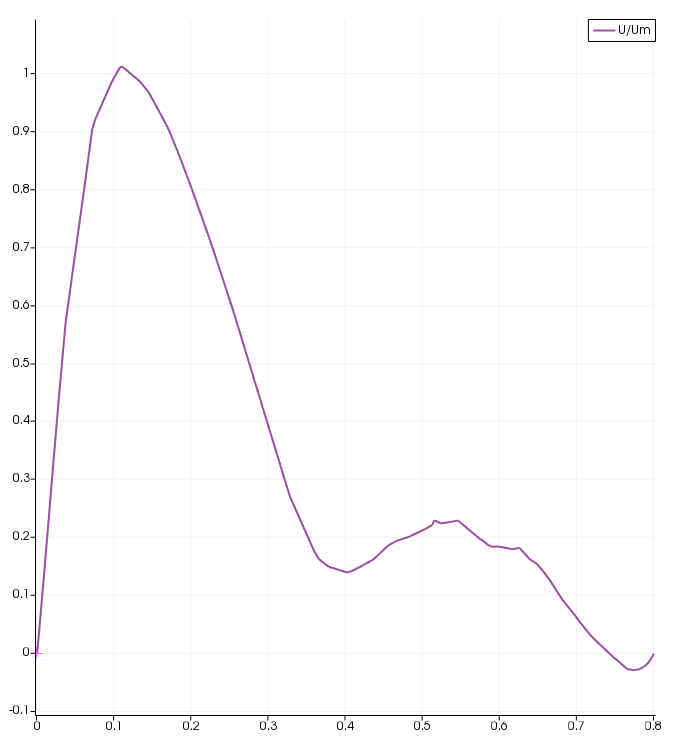
I have simulated the blood flow in a thoracic aorta case using the SimVascular software with high-resolution mesh (2M elements). I have used the Paraview software to report the results. In order to show the variation of stream wise velocity along a line in an arbitrary cross section, I firstly used the “Slice” command to export that cross section. Then, I used the “Extract Selection” command to extract selected elements from that dataset. After that, I used the “calculator” command to define stream wise velocity based on the velocity components. Finally, I used the “Plot Over line” command with high resolution (1000) to export the results (stream wise velocity) over a line. However, I can see some bumps along my plot over line. I have attached the plot that I have exported.
I would be wondering if you could guide me on this issue.
Best regards,
Ezat Shokrani
Hello Ezat and welcome on the ParaView discourse,
since the chart only interpolate linearly the data between each sample point you can try to increase the resolution of your Plot Over Line filter. I don’t know how may cells there are in your selection but 1000 doesn’t seem like a very high resolution to me against big datasets.
Also are you sure the slight variation isn’t coming from your data ? Can you share a screenshot of the Calculator output with the data array you plotted used for the color map, as well as the line widget displayed ? I’m guessing you’re using ParaView 5.9.
Dear Mr. Timothee Chabat,
Thanks for your response and explanation. In fact, these results are related to one of my projects and I prefer not to share them to the public forum. I would be wondering if you could provide an email until I can send all the data to you.
Best regards,
Ezat Shokrani
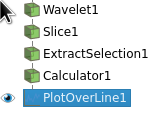
This is the pipeline you sent to me :
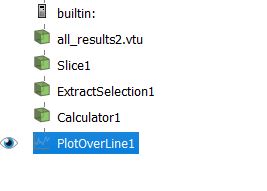
But from your description I believe you want to do the following ? (replacing Wavelet1 by all_results2.vtu)
If so beware of your active source before creating a filter.
Dear Mr. Timothee Chabat
Thanks for your response and help. In fact, I have some data with the vtu format (all_results2.vtu file that I have firstly imported into Paraview). However, Based on your pipeline, I do not see where I should import my data. I would be wondering if you could guide me on this issue.
Best regards,
Ezat Shokrani
In my pipeline Wavelet was a placeholder for your data. Your current pipeline is :
 `all_results2.vtu` -> `Slice` -> `ExtractSelection`
                  |
                  L-> `Calculator` -> `PlotOverLine`
but I believe you want :
`all_results2.vtu` -> `Slice` -> `ExtractSelection` -> `Calculator` -> `PlotOverLine`
meaning your filters are good but not in the right order.
If you’re not sure what I’m talking I suggest you read the following sections of ParaView’s documentation :
Dear Mr. Timothee Chabat
Thanks for your response and providing the links which were useful. Based on your last message, if I want to have your pipeline, Paraview does not allow me to use “Plot Over Line” after I have created “Calculator”. In fact, this option (Plot Over Line) is inactive and therefore, I have to choose ’
all_results2.vtu’ Until I can use "Plot Over Line’. That’s why my pipeline seems this way.
Any way, even if I use ‘Plot Over Line’ in the following, I can see those bumps over the line in my plot.
all_results2.vtu → PlotOverLine
Do you think I am doing something wrong wit the use of ‘PlotOverLine’ or maybe my data has such fluctuations? I would be so grateful if you could help me solve this issue.
Kind regards,
Ezat Shokrani
I think there’s still something wrong wth your pipeline. I believe you cannot apply plot over line because your input is empty. This might be because you had not selected anything before applying Extract Selection. For the filter Extract Selection you first have to select some data (see all the ways of selecting data here 6. Selecting Data — ParaView Documentation 5.8.1 documentation) and then hit the apply button.
Dear Mr. Timothee Chabat
Thanks for your response and patience. Firstly, you were right that because I had not selected anything before applying ‘Extract Selection’, I could not have your pipeline. Now, based on your suggestion, I used

button to select all nodes on ‘slice’ and therefore my pipeline is like yours.
However, when I used the ‘PlotOverLine’ filter, I got the following plot.
I am not certain why this happens. I even changed the resolution from 1000 to very high amount like 100000 and 1000000 but, nothing new happened. I would be wondering if you could help me.
Finally, you did not answer my question from the previous message when I used the following pipeline (without any ‘ExtractSelection’) and got the same plot.
all_results2.vtu → PlotOverLine
I would be so grateful if you answer this question too.
Thank you so much for taking time and your consideration.
Best regards,
Ezat Shokrani
A few things here :
If you want to plot the data of your whole slice then Extract Selection is useless here, just remove it from your pipeline.
You got the same plot because you likely plotted the same data. Plot Over Line can plot all your data array between two points P1 and P2. You can change these points coordinates either with the interactive 3D array in your render scene, or either directly in the properties panel (bottom left corner of Paraview) : Properties - Line Parameters - Point1/2. So far you’ve been plotting the data array named U/Um. If you want to plot another data array then change it in Properties - Display - Series Parameters. Here you can choose your X axis and the data to plot.
These holes can appear because of 2 reasons (that I can think of) :
- there’s hole in your slice hence there’s no data to display at some places
- some of your cells contains
NaN values (displayed in yellow in the render view with the default color map). NaN values are not displayed by the plot, hence the holes.
To say that your data actually has these bumps is still a bit early because I think your pipeline isn’t quite yet correctly setup.
Overall I feel like you’re new to ParaView (welcome!) but you’re still not sure what are the purpose of each filter and how you should use them. I suggest you really dive more into how to display data in ParaView in general and not for your specific use case, and quickly read the documentation for each filter you use and their properties.
Dear Mr. Timothee Chabat,
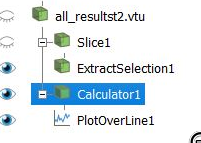
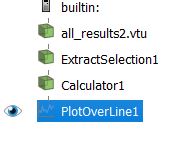
Thanks for your response. In fact, I have used ‘Paraview’ a few years ago and have forgotten some actions required to be done. I am reading some of documentation to remind myself. ‘Slice’ is an extra work and not required for my plot. I only use it for my another plot to show the results as a contour. Therefore, I got rid of it from my pipeline to remove any ambiguity which can be caused. Now, I have this pipeline:
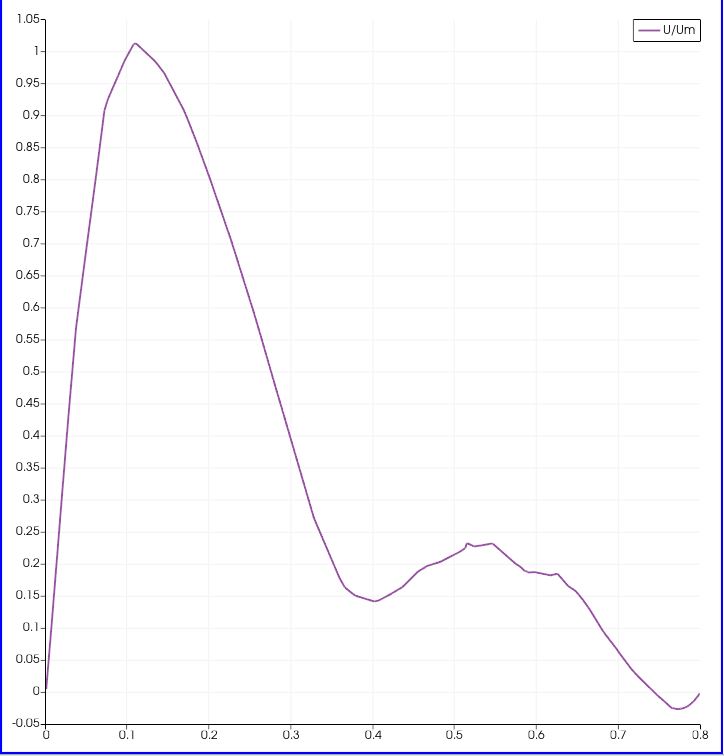
I am using your below command to plot data over line. I am plotting U/Um amount.
Properties - Line Parameters - Point1/2
And the results sounds like this:
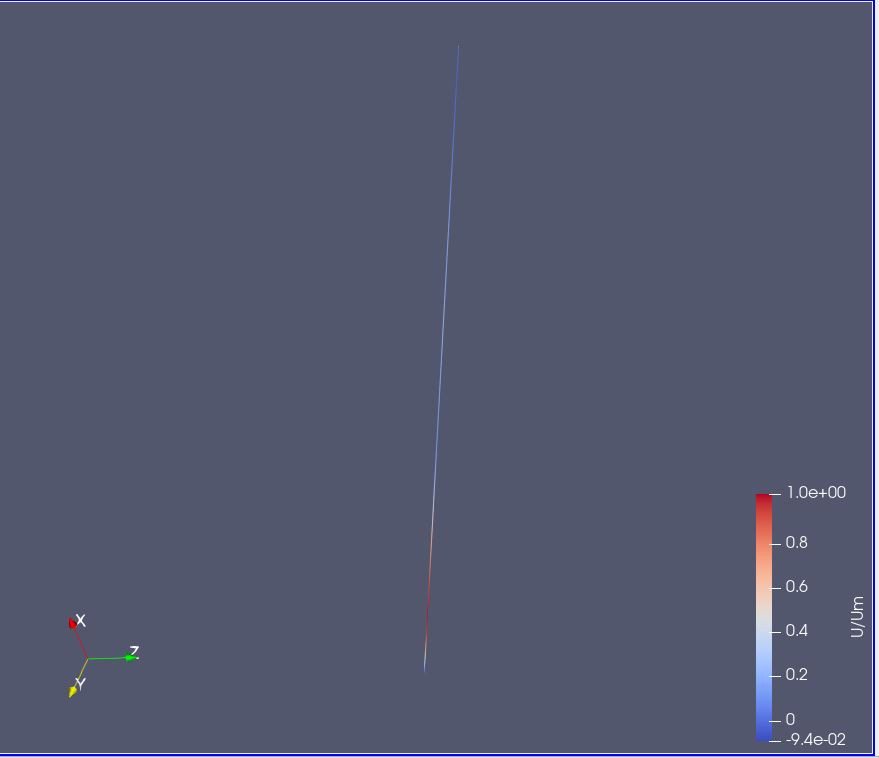
I have also shown a graphic view of the line
Those bumps still can be seen. I would be so grateful if you guide me on this issue.
Kind regards,
Ezat Shokrani
Hello Ezat,
I was in vacation so I could not respond to your message. Anyway now your pipeline looks correct so I guess these bumps are coming from your data.
If you’re absolutely sure your data is correct and this is a bug then please open an issue on the ParaView Gitlab with clear steps to reproduce and associated data (https://gitlab.kitware.com/paraview/paraview/-/issues).
Also please read this post : How are features and bug fixes incorporated into ParaView?. If you want to be prioritized you can ask for support on Kitware websites (https://www.kitware.eu or https://www.kitware.com).