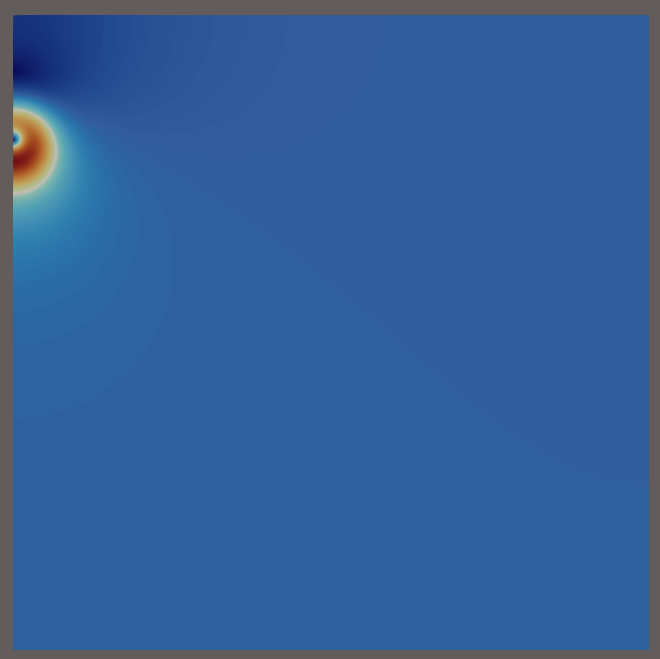
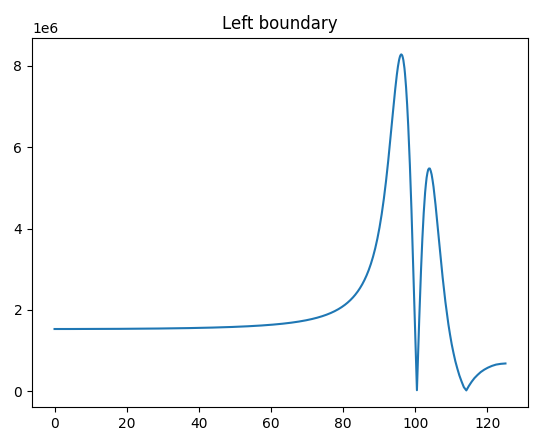
I would like to be able to plot a scalar quantity along a 1D boundary of a 2D domain in Paraview. For example, given the 2D domain below, I would like to extract a plot of the scalar field along the left boundary. This data comes from a finite element simulation that uses a triangulation of the domain.
To date, my workflow for doing this exists entirely outside of Parview. I collect the boundary faces, orient them in the same direction, and then plot the scalar field restricted to these faces. However, I would like to be able to use the flexibility and abstractions that Paraview offers. I have the following potential approaches in mind:
-
Add a separate 1D mesh representing the submanifold (boundary) to the VTK file that uses the same coordinates as the primary mesh, then use PlotData to plot the data on this mesh.
-
Use the Plot Over Line filter on the 2D mesh.
Both of these have downsides, namely that the first option requires adding additional fields to the visualization file in order to represent information that is already there (redundancy), while option 2 is restricted to straight boundaries and is difficult to line up exactly with the true domain boundary.
I am building my .VTK files using PointData on an unstructured grid. I looked at this support thread: Surface plot or polyline plot and was hoping to apply this workflow to my case, but it looks like Extract Feature Edges is not available for my datasets – there was a message saying that Extract Feature Edges it is only available for vtkPolyData.
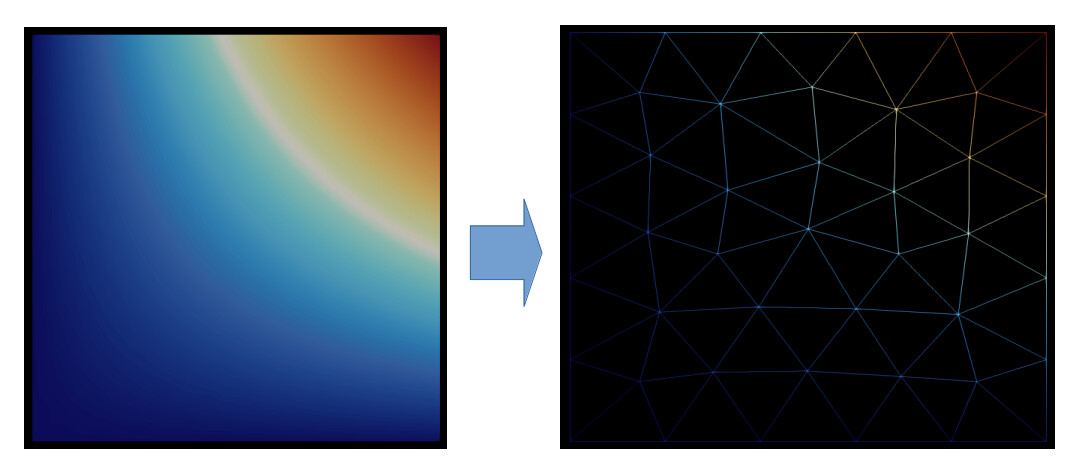
I tried using Extract Edges with this dataset, but it extracted the edges from all elements in the mesh, including the interior elements. This is not what I am looking for (see the screenshot below):
Does anybody have advice or a preferred workflow for this? It seems like this is a pretty common need when plotting surface quantities, such as pressure coefficient in a CFD simulation.
To complicate my situation, I am trying to fully transition my workflow to use the CellGrid data structures that natively support Discontinuous Galerkin discretizations. I have worked with @dcthomp on this before, not sure if you have some advice to lend here? When I open the CellGrid dataset, I can’t use Extract Edges because it is only available for vtkDataSet. Any help would be appreciated. I have attached small examples of both the PointData .vtk file and the CellGrid .dg files that I used to produce the results.
squarePointData.vtk (8.9 KB)
squreCellGrid.dg (7.9 KB)