I have a CSV file with comma separated coordinates and a velocity vector of the form: X, Y, Z, Vx, Vy, Vz similar to this post Creating vector field from csv data. I can use the table to points filter with XYZ coordinates, use merge vector components filter to merge Vx, Vy, Vz into velocity vector, and then use glyph filter to visualize the velocity vectors at each point. However, I want to create a 3D contour using the velocity vector and points or a 2D contour using the YZ vectors and points. Is this possible with this data format?
you should be able to use the Table to Structured Grid filter as suggested in the previous thread and apply the contour filter on in.
If not could you share some example data ?
When I apply Table to Points and then the Contour filter with compute gradients checked and contour by Vz, I don’t see any visual appear. I’ll try to see if Table to Structured Grid works with contours, but I haven’t been able to so far. Here is an example of what a section of the data looks like.
data.csv (163.3 KB)
Thank you for sharing the data!
Indeed the Table to Points is the right filter for the first step based on your data.
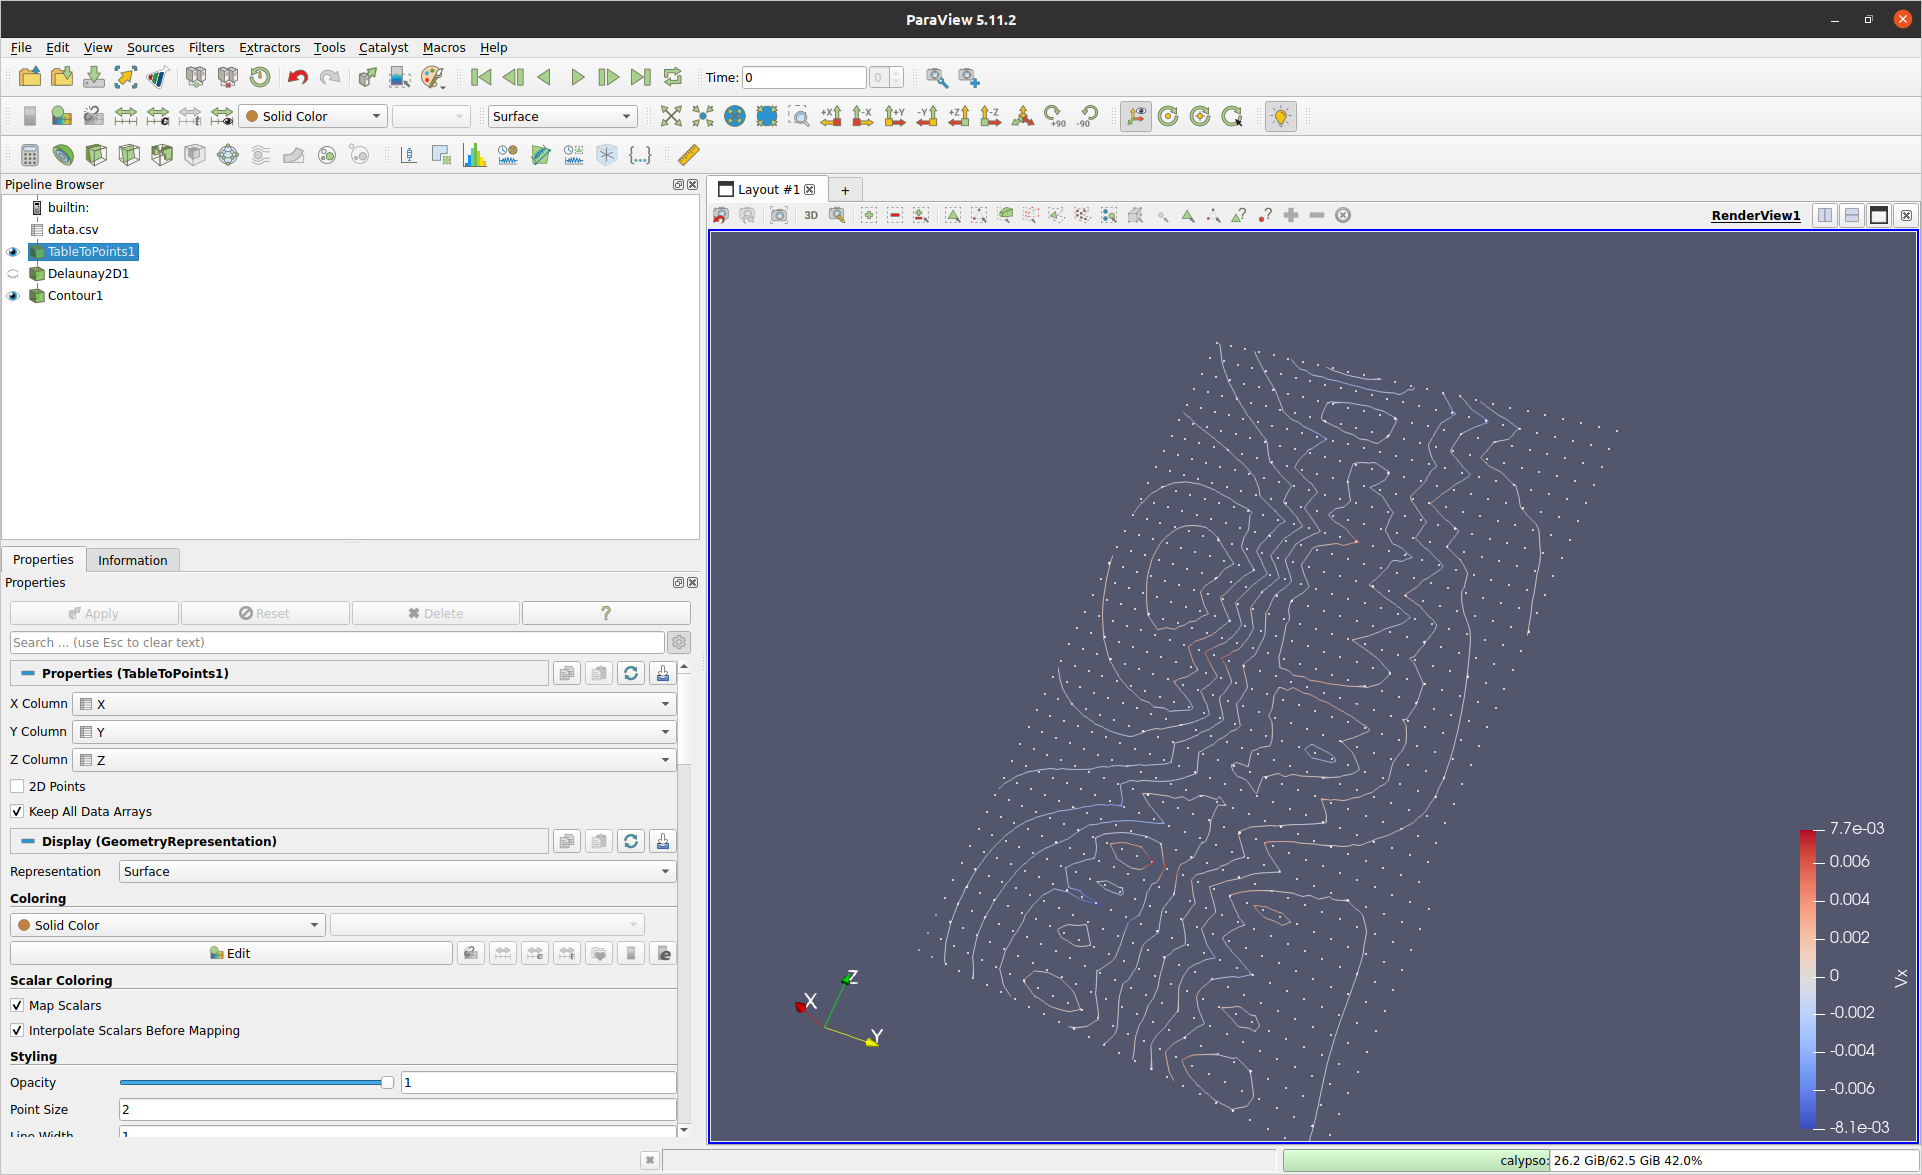
Before you can apply contour you would need to have a mesh connecting the points.
Since the points fit on a plane you can use the Delaunay2D filter using Best-Fitting Plane as projection Plane mode and then apply the contour on the output of it.