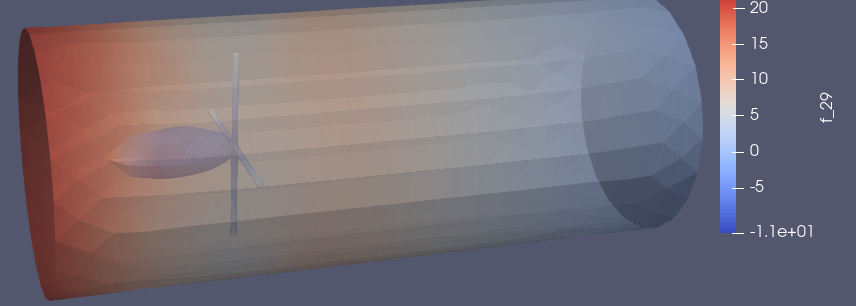
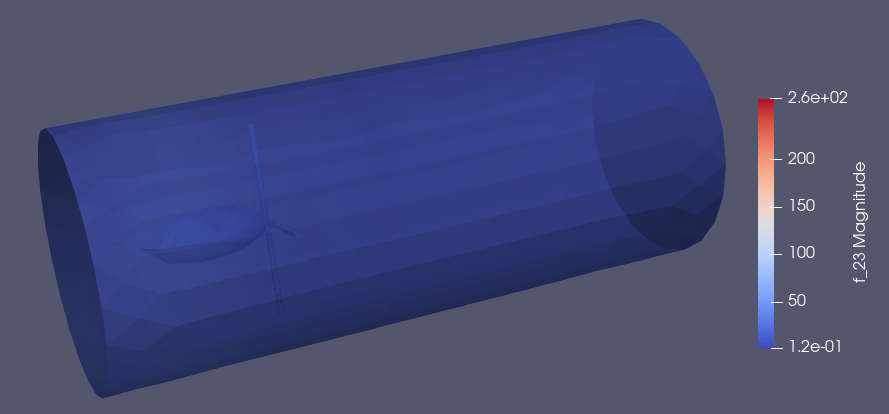
hello everyone, I would ask some help in order to better understand my simulation results, the following images represent the pressure and the velocity field on a 3D domain.
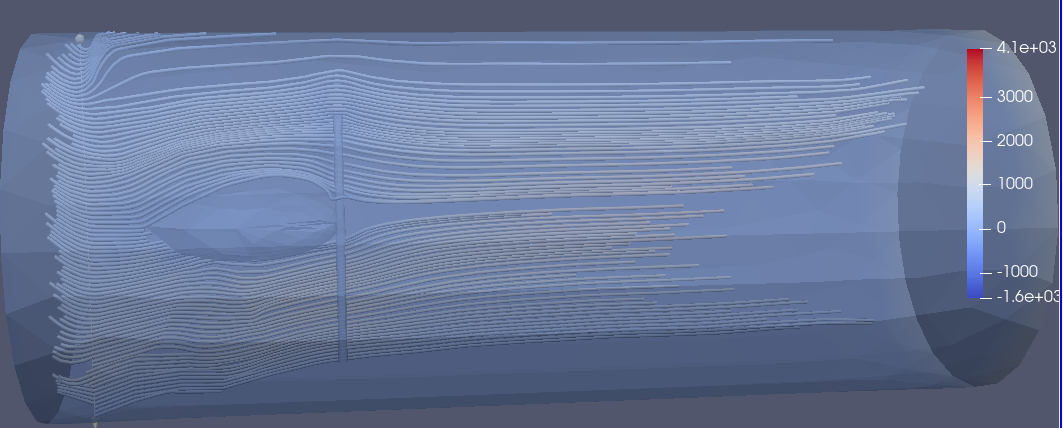
I know that there is the streamtracer filter which allow us to visualize the streamlines of the velocity field. But this is the result I get appying it, in two different position of the domain.
Sure, in this folder there are the code, the geometry and some results in .pvd format. What I want to visualize is the streamlines around the object, but unfortunately I can’t do that for all boundary condition, it works only when boundary condition for the inlet and the outlet are equal, I don’t know if is it an error in the code or just in visualization.