Dear all,
I just saw, that the newest release of Paraview supports 2D Transfer functions for volume rendering which maps data with 2 components by applying the colormap to the first component to determine colour and the opacity function to the second colormap. However, my Impression ist, that it does not work.
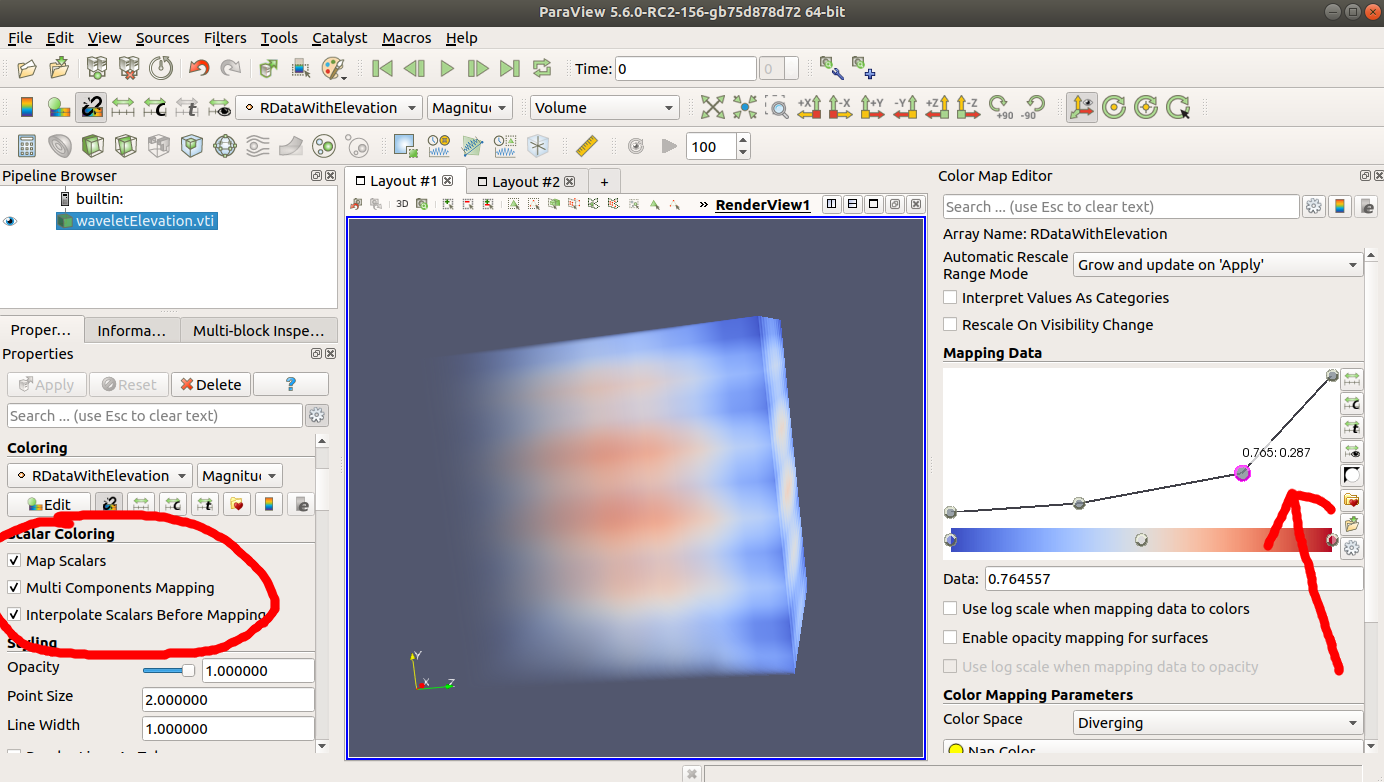
Under “Scalar Coloring” I switched on “Multi Components Mapping” “Map Scalars” and “Interpolate Scalars Before Mapping”. Representation is switched to “Volume” of course.
Using a “Structured Points” data set as Input I can specify the two transfere functions independently (comp1 -> Color, comp2 -> opacity), but the opacity seems to have no affect (rendering is fast and the whole model is rendered as beeing opac).
When I use a structured grid as Input, the function for opacity and color seem to be Independent but the rendering looks like they are dependent. So the behavior is as if “Multi Components Mapping” is switched of.
Has somebody experience with this functionality and/or is there an example data set available that works?
Multi-component mapping works fine on my side.
When activated, this mode removes the color below the opacity curve in the color map editor (see the picture below).
Here is the dataset we use in our unit test: waveletElevation.vti (73.5 KB)
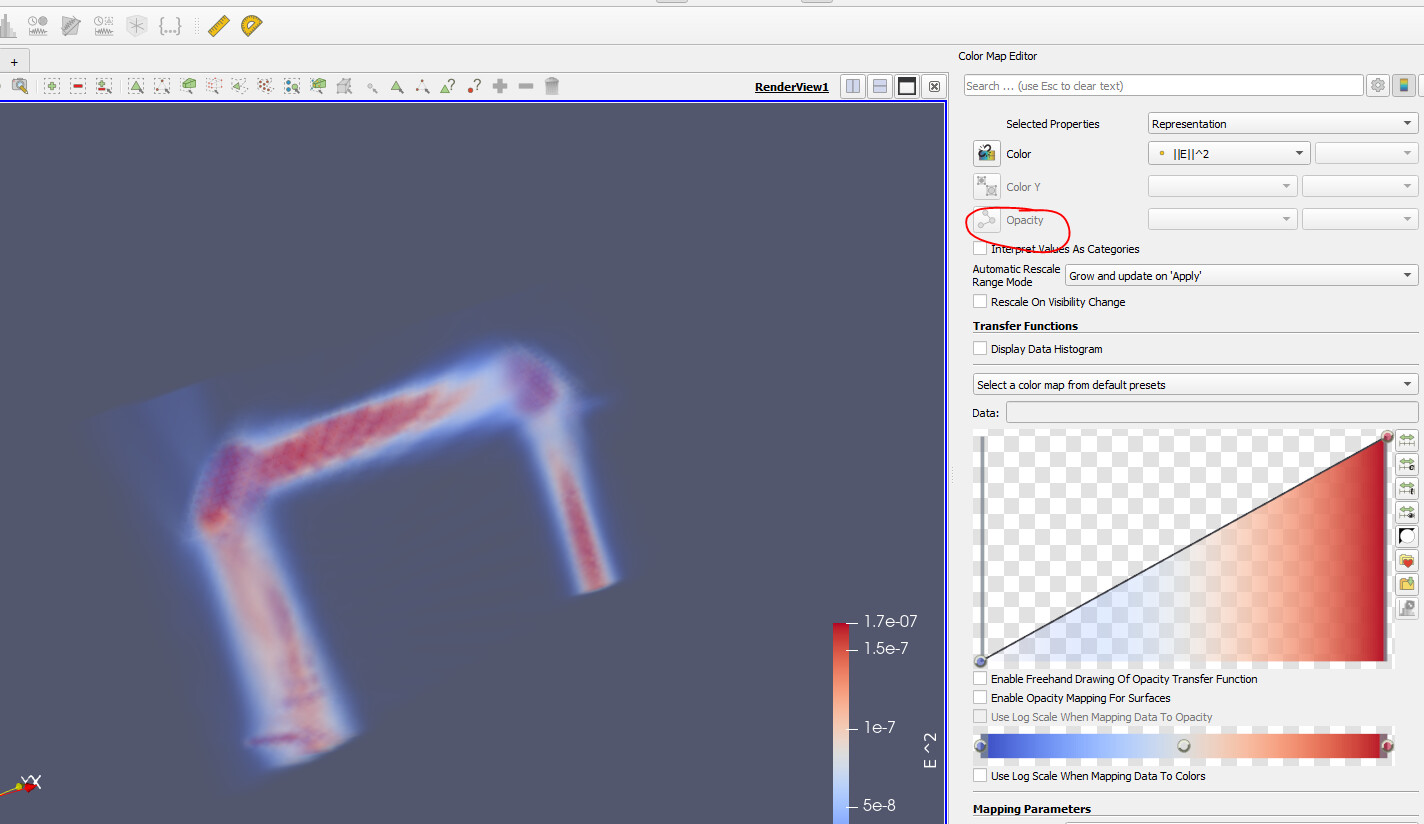
Is this only valid for vti or can this work for say structured volume data? I have a 3D StructuredGrid representing the 3D complex electric field that I’m generating in pyvista. I can indepdently view as a volume the scalar field “||E||^2” corresponding to field intensity, and also the scalar “phase(Ex) (unwrapped)”. Both look as intended but what I want is the colormap to correspond to the phase advance and the opacity to correspond to magnitude, basically I don’t care much about the phase where the field is low and accordingly the unwrap algorithm becomes noisy.
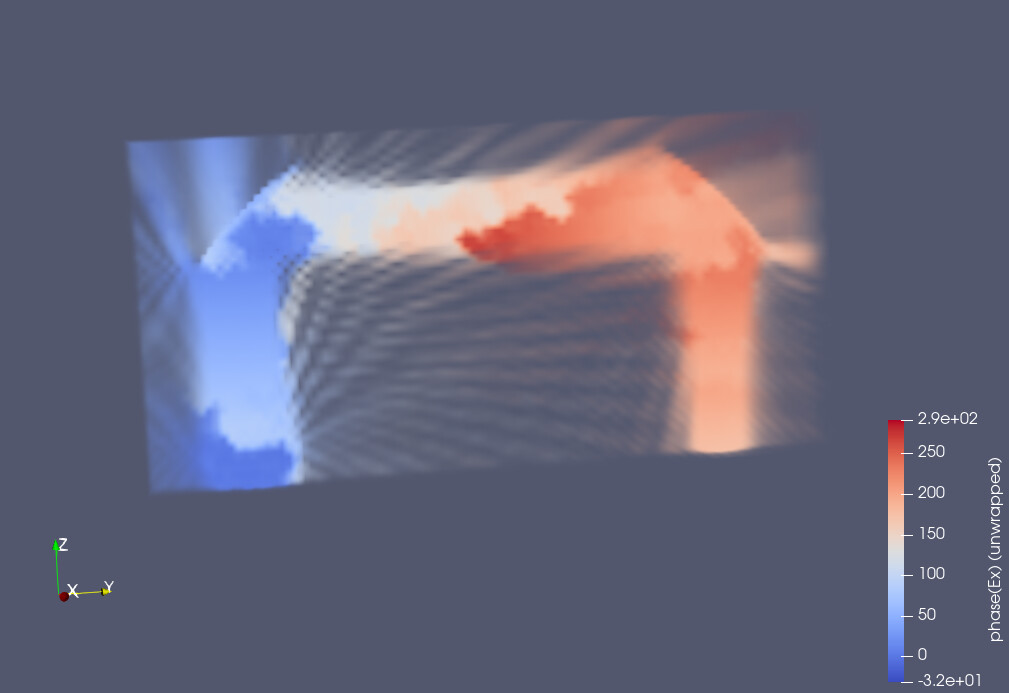
that does seem to work, though it appears that the scalar coloring can only be positive if an opacity filter is applied independently. As you may see in this image, basically there is negative unwrapped phase below zero that is cropped (I had to negate the entire distribution otherwise almost all the data was cropped to 0)