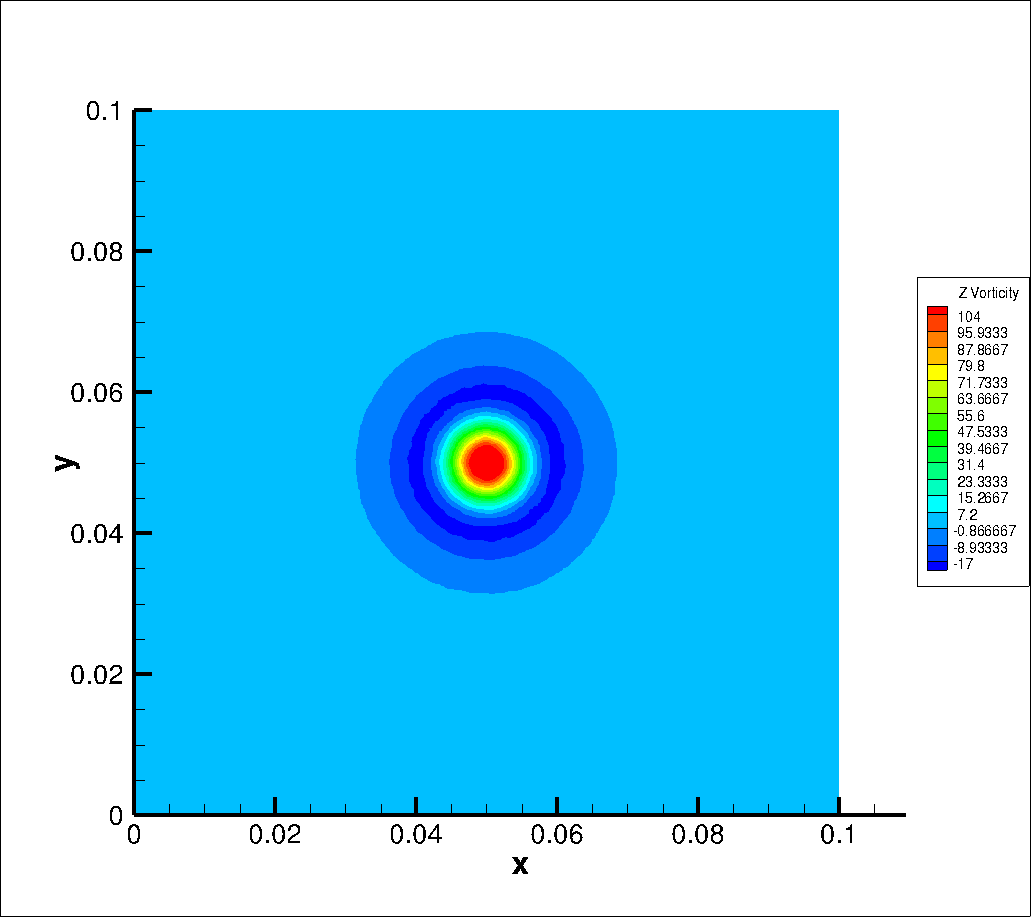
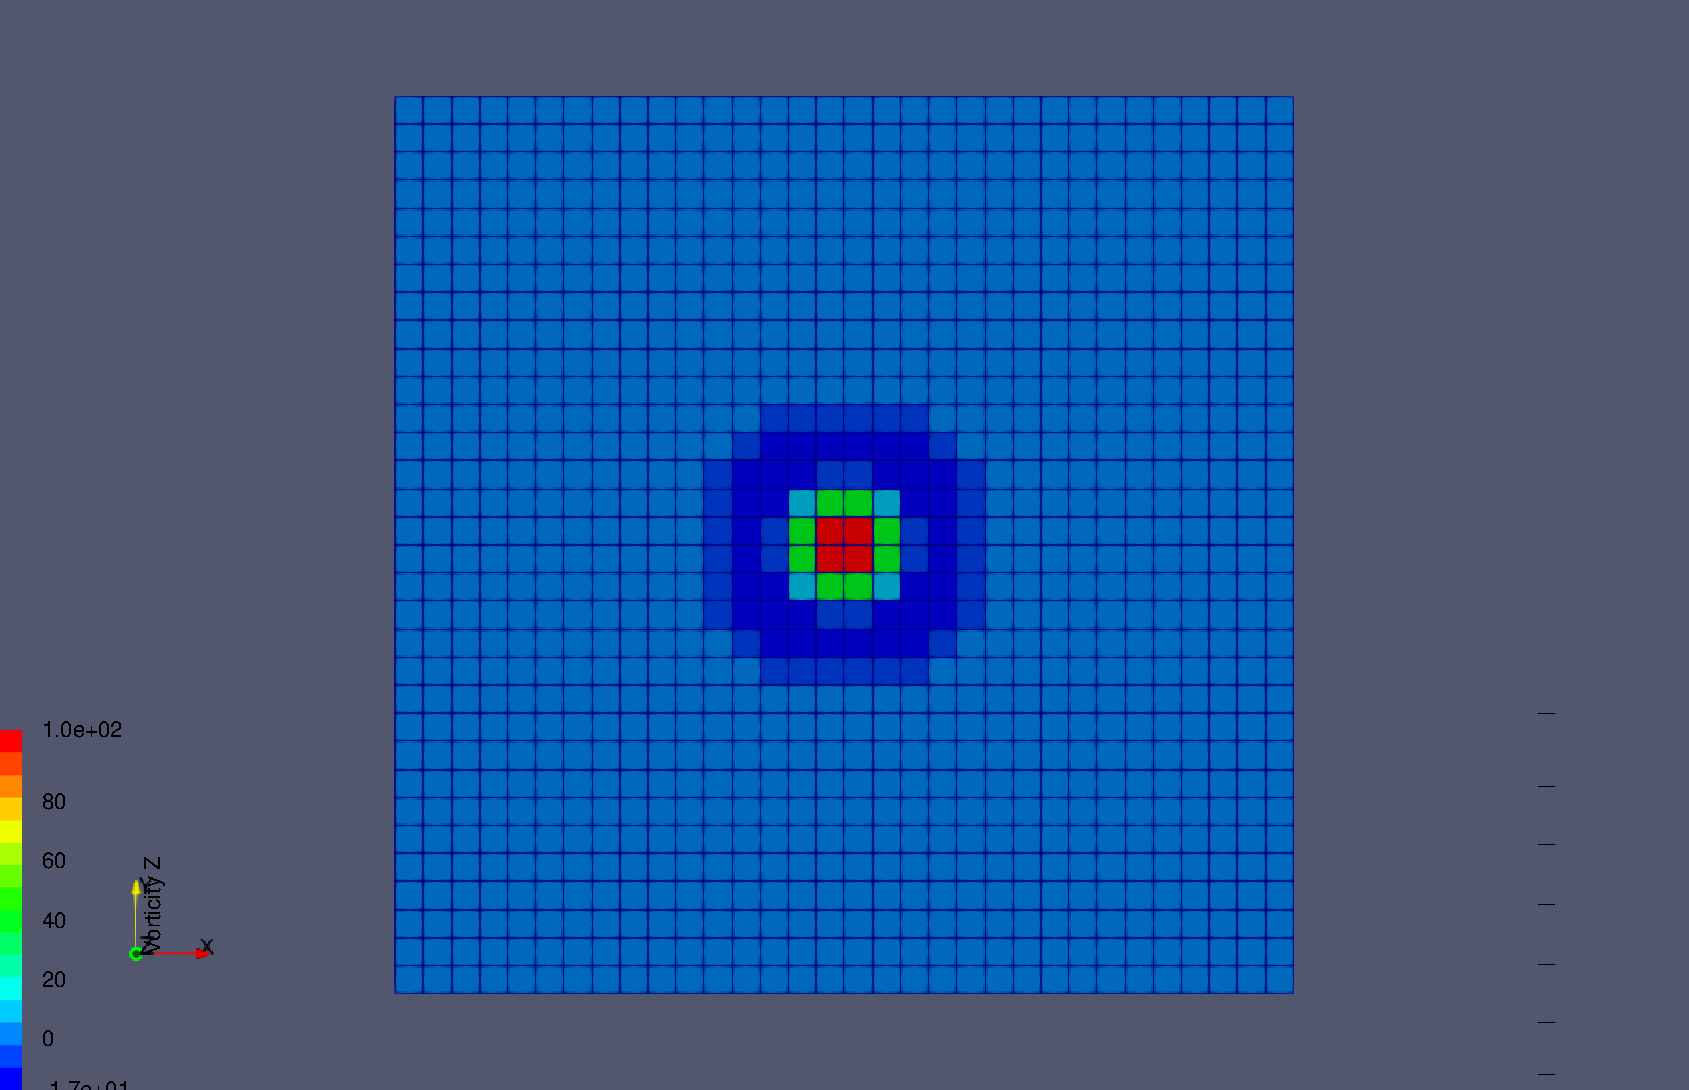
Vorticity calculated for a smooth vortex function using python calculator as curl(Velocity) gives wrong result using the Legrange Hexahedron element. I tried to plot the same in tecplot using a point data and traingulation, the result looks fas it should on tecplot. I used the same number of levels,range,etc.
As you can see from the figure for paraview plot the vorticity doesn’t vary in the cell for the paraview plot as it should(since its lagrange hexahedron), it gives out a constant value for each cell. I have used lagrange point data and triangulation(which is an approximation) to plot in tecplot and it still gives a better result than paraview. I strongly think it is a major issue in paraview for this cell type.
Process in making the state file:
Create a “Velocity” vector from u,v,w scalar values from data using Calculator Filter
Create “Vorticity”, from velocity vector using curl(Velocity) in Python Calculator Filter
Plot the “Z-Vorticity”
Process to reproduce:
Paraview-Open the data file and then open the state file to perform the vorticity calculation.
Tecplot -Open the layout file with datafile in same folder.
Hi all,
Could someone redirect this to anyone who could resolve this issue? I have been trying to find a solution for this for sometime now, but had no response whatsoever.
vrkssai,
I don’t know vorticity or gradients whatsoever (CS major here), but I believe your issue is one of understanding, not calculation. ParaView holds variable data in two ways - either cell (element) based or point (node) based. Cell data always paints all pixels in each cell the same, where point data will be linearly interpolated across the cell. In graphics terms, cell data is flat shading, point data is gouraud (interpolated) shading.
Try your top example, and convert your variable data to point data with the Cell Data to Point Data filter. Alternatively, convert your lower example to cell data with the Point Data to Cell Data filter.
@wascott All the computations were done using point data only, Lagrange hexahedron doesn’t support cell data.(I’m 90% sure of it). I remember trying to change the data from point to cell and getting an error.
OK, I dug deeper into it. I believe you are correct - this appears to be a ParaView bug.
The way I tested this is that I used filter clip, then clipped off a small side of your data. This converted your data to tets, and it works correctly. It also works correctly if you run the tetrahedralize filter on the data before the pyhon calculator.
I have reopened the bug. Thanks for this bug report - it is well done.