I have a data set of 400 points, each with an X, Y, Z and a name. I want to plot these in 3D space and have a little label attached to each point.
So far I’ve struggled to get any kind of String attached to the data, but even if I get that working I’m not sure what the next step in Paraview would be to display the data this way.
My latest attempt at adding string data in array to an XML .vtp file (small example format):
…but this crashes ParaView. If I remove the data block for the point names then it imports and displays correctly (albeit obviously without any way to display a name label).
Can anyone suggest a way to fix the XML file, and then what steps might be required to plot the data with labels?
Thanks! That seems to get the data into the file at least:
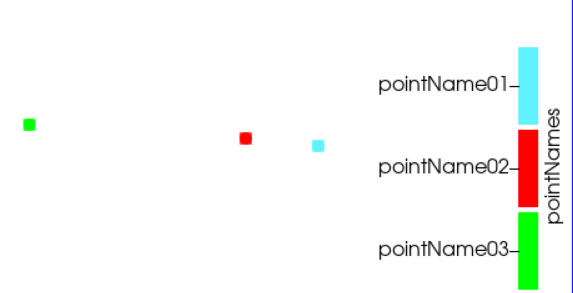
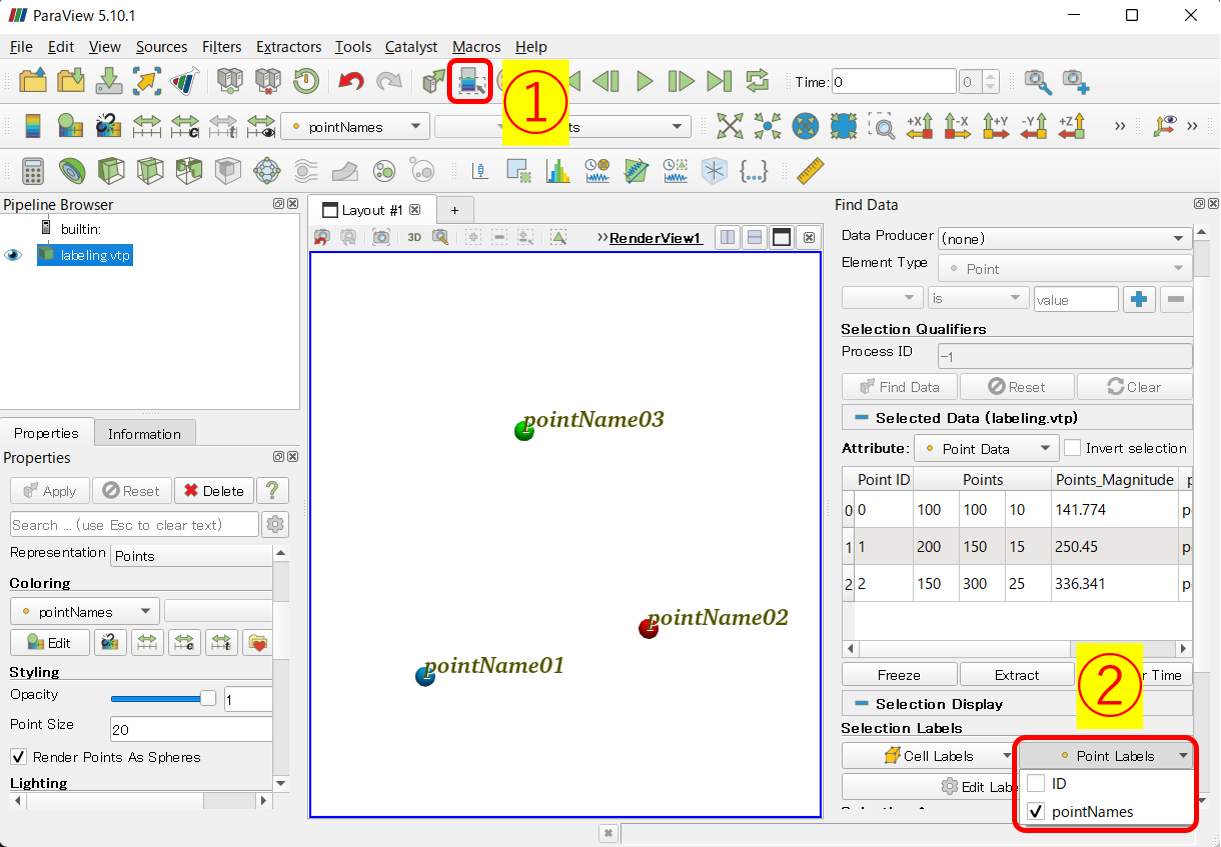
…but I can’t figure out any way to get the names to appear floating next to the points. I have hundreds of data points and trying to color code all the points and referring to a legend is not going to be useful. Is there any way to get the individual names shown? Weirdly even hovering over the points with the inspector tool thing doesn’t show the name.
Thanks! This seems to mostly do what I want, but I don’t seem to be able to have more than one dataset display the labels at one time. It seems that I can can only select points in one dataset, so only that particular dataset can have the labels displayed at that point in time?
Is there a way to have the displayed labels in one dataset ‘preserved’ so that as soon as I select any points in another dataset that the first set of labels don’t disappear?
The only way I could think of was to combine multiple datasets into one dataset using the Append Datasetas filter or the Append Geometry filter.
There may be a better way.
Being able to add annotations at given positions to a VTK file is something that I’ve also needed a few times but never reached the point of desperation. It looks like something that would more naturally fit inside a type of field-data, since I would typically have a geometry with thousands/millions of points and elements but perhaps only a 20-50 places where I might want annotations (eg, for labeling boundary regions or centres of zones). It would thus be nice to be able to distinguish between these and the general data associated with the mesh.
I just added these notes as a comment in case someone is gathering requirements/use-cases somewhere/sometime.