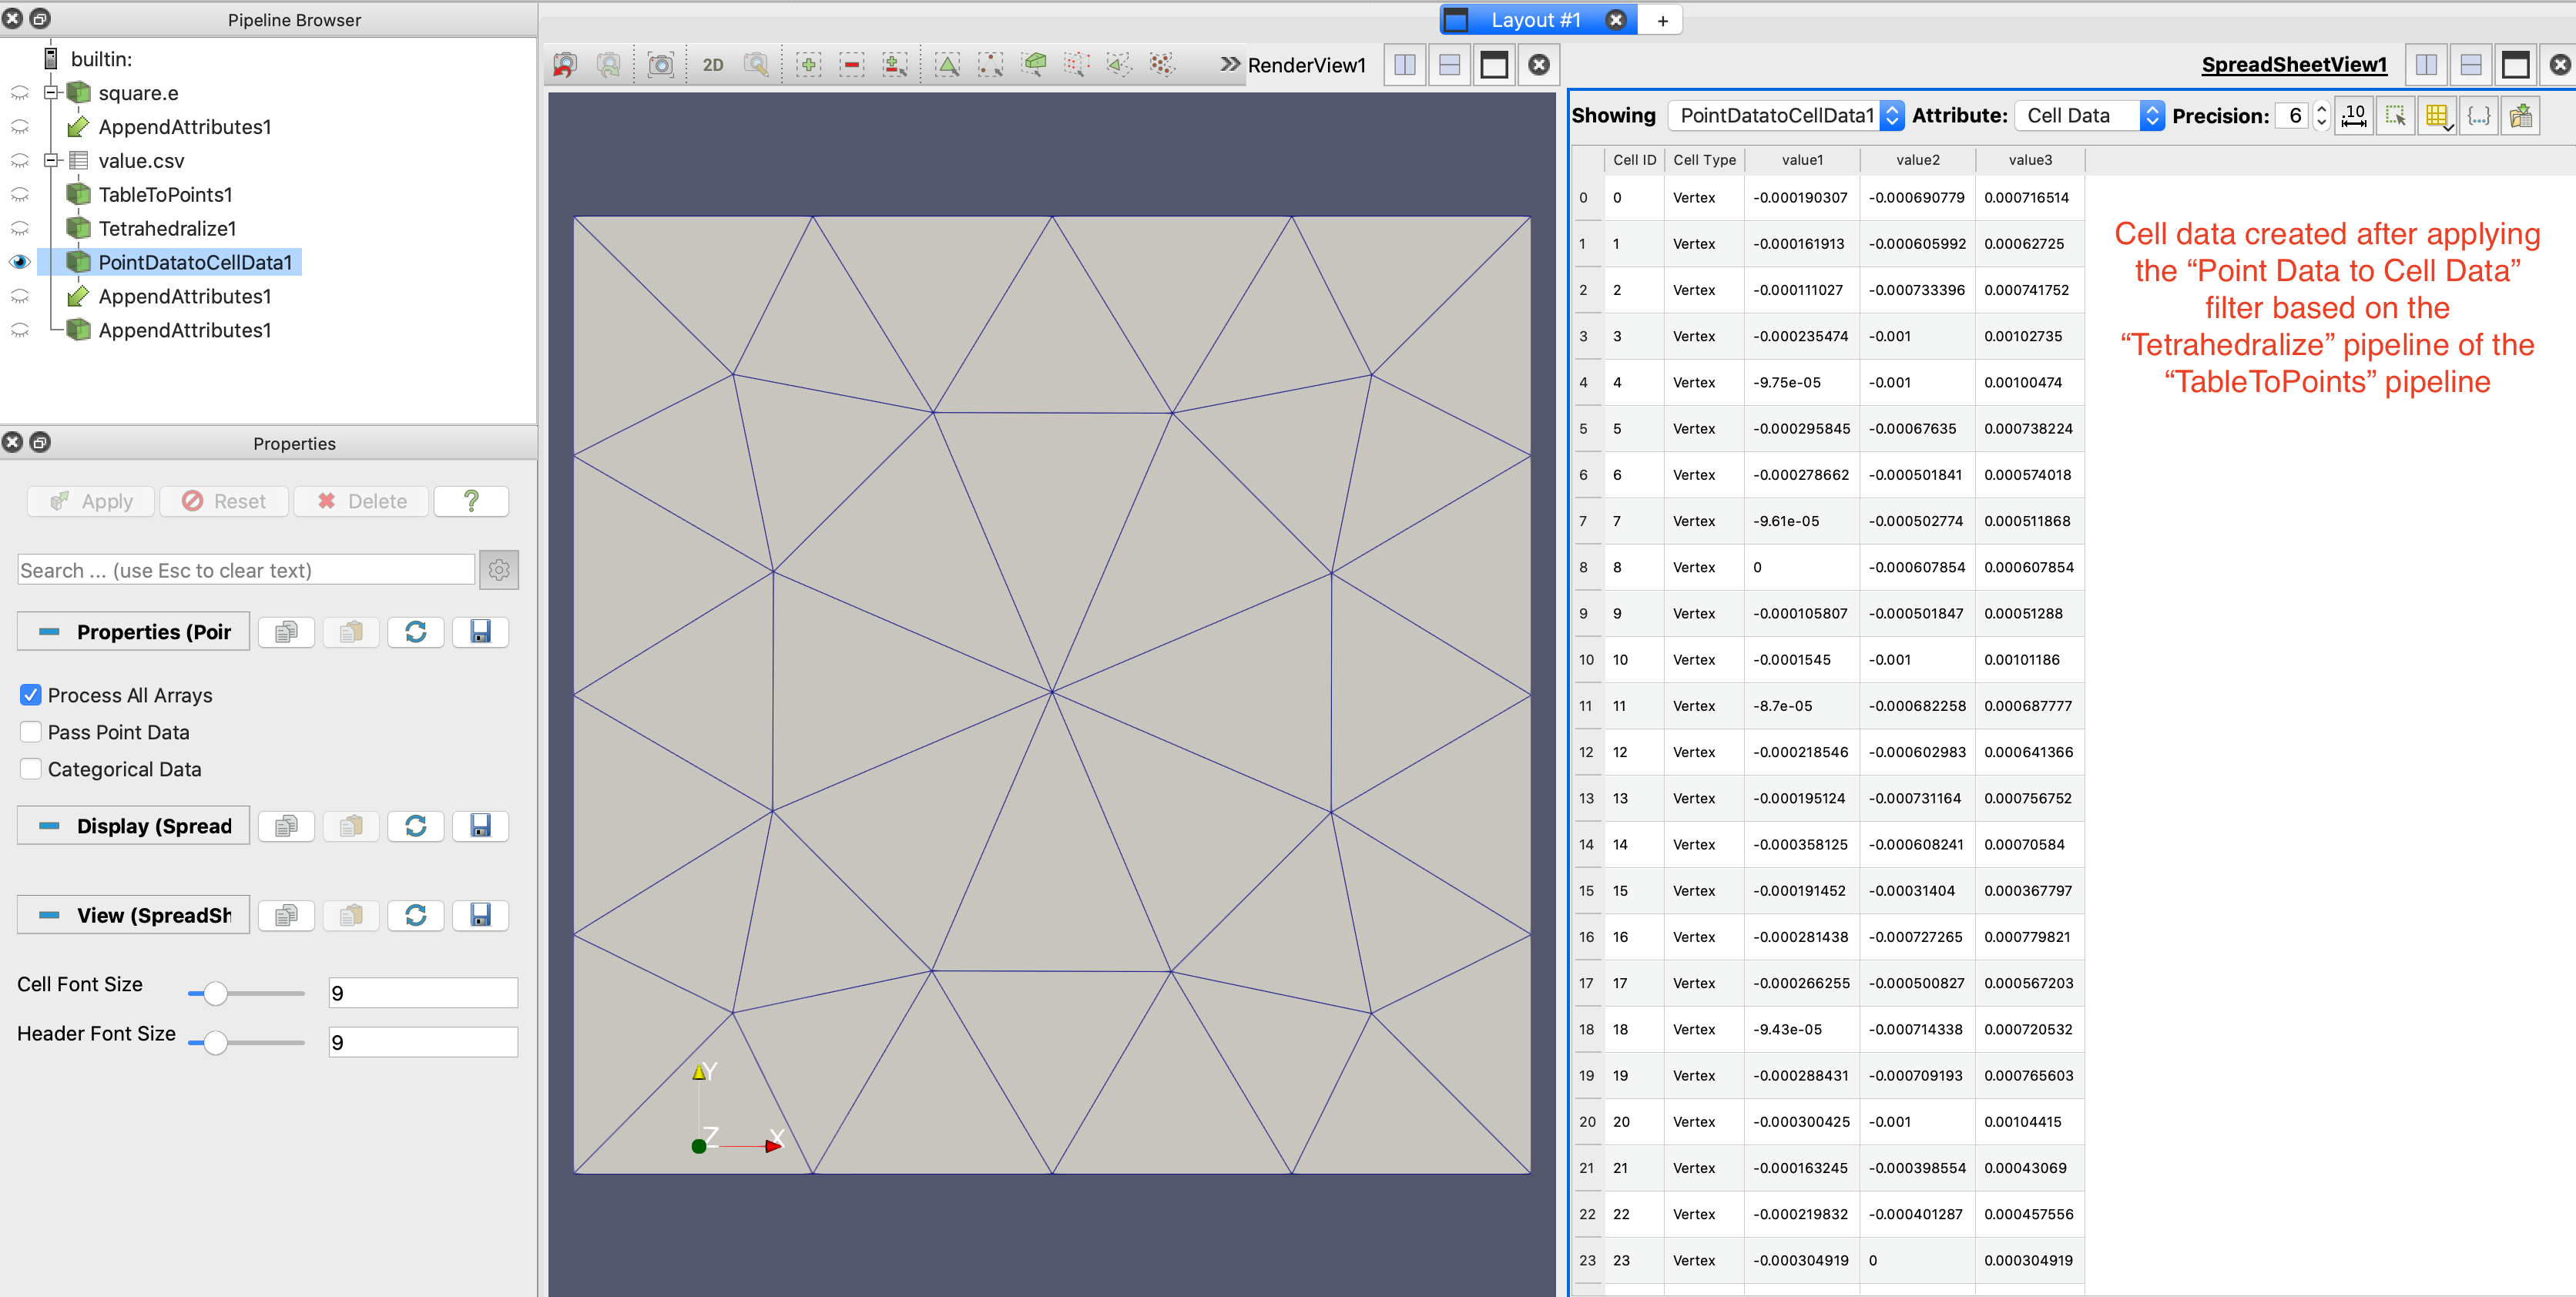
I have an exodus mesh file and a csv data file. The csv data are cell data, i.e., the data are for element in the mesh file. Now, I would like to “combine” these two files so that I can visualize the csv data on the mesh. I tried to follow the topics of Supplementing cells data with an additional column with the user values and Render user data on an unstructured grid but without any success. The problem for me is that after I control select the mesh data (first) and the PointDataToCellData (second) and “append attributes”, the created cell data in the PointDataToCellData pipeline didn’t append to the mesh data in the newly created “AppendAttributes” pipeline. Here are the screenshots for the problem I described above. BTW, I’m using PareView 5.9.0 and on a MacBook Pro. I also tried other version and a Linux machine, and it didn’t work for me neither.

I’m also attaching the two files here and any help to have my problem solved will be much appreciated.
square.e (4.4 KB) value.csv (1.4 KB)