Please help how to render external user data on an unstructured grid (i.e. using colored surfaces as usual represent deformation, stress, velocity etc.)
I imported the model into Paraview from another program, so I have an unstructured grid with cells and points data. Cells data (stress, strain) is rendered correctly. I also prepared external data in such a way that each cell corresponds to an external user value
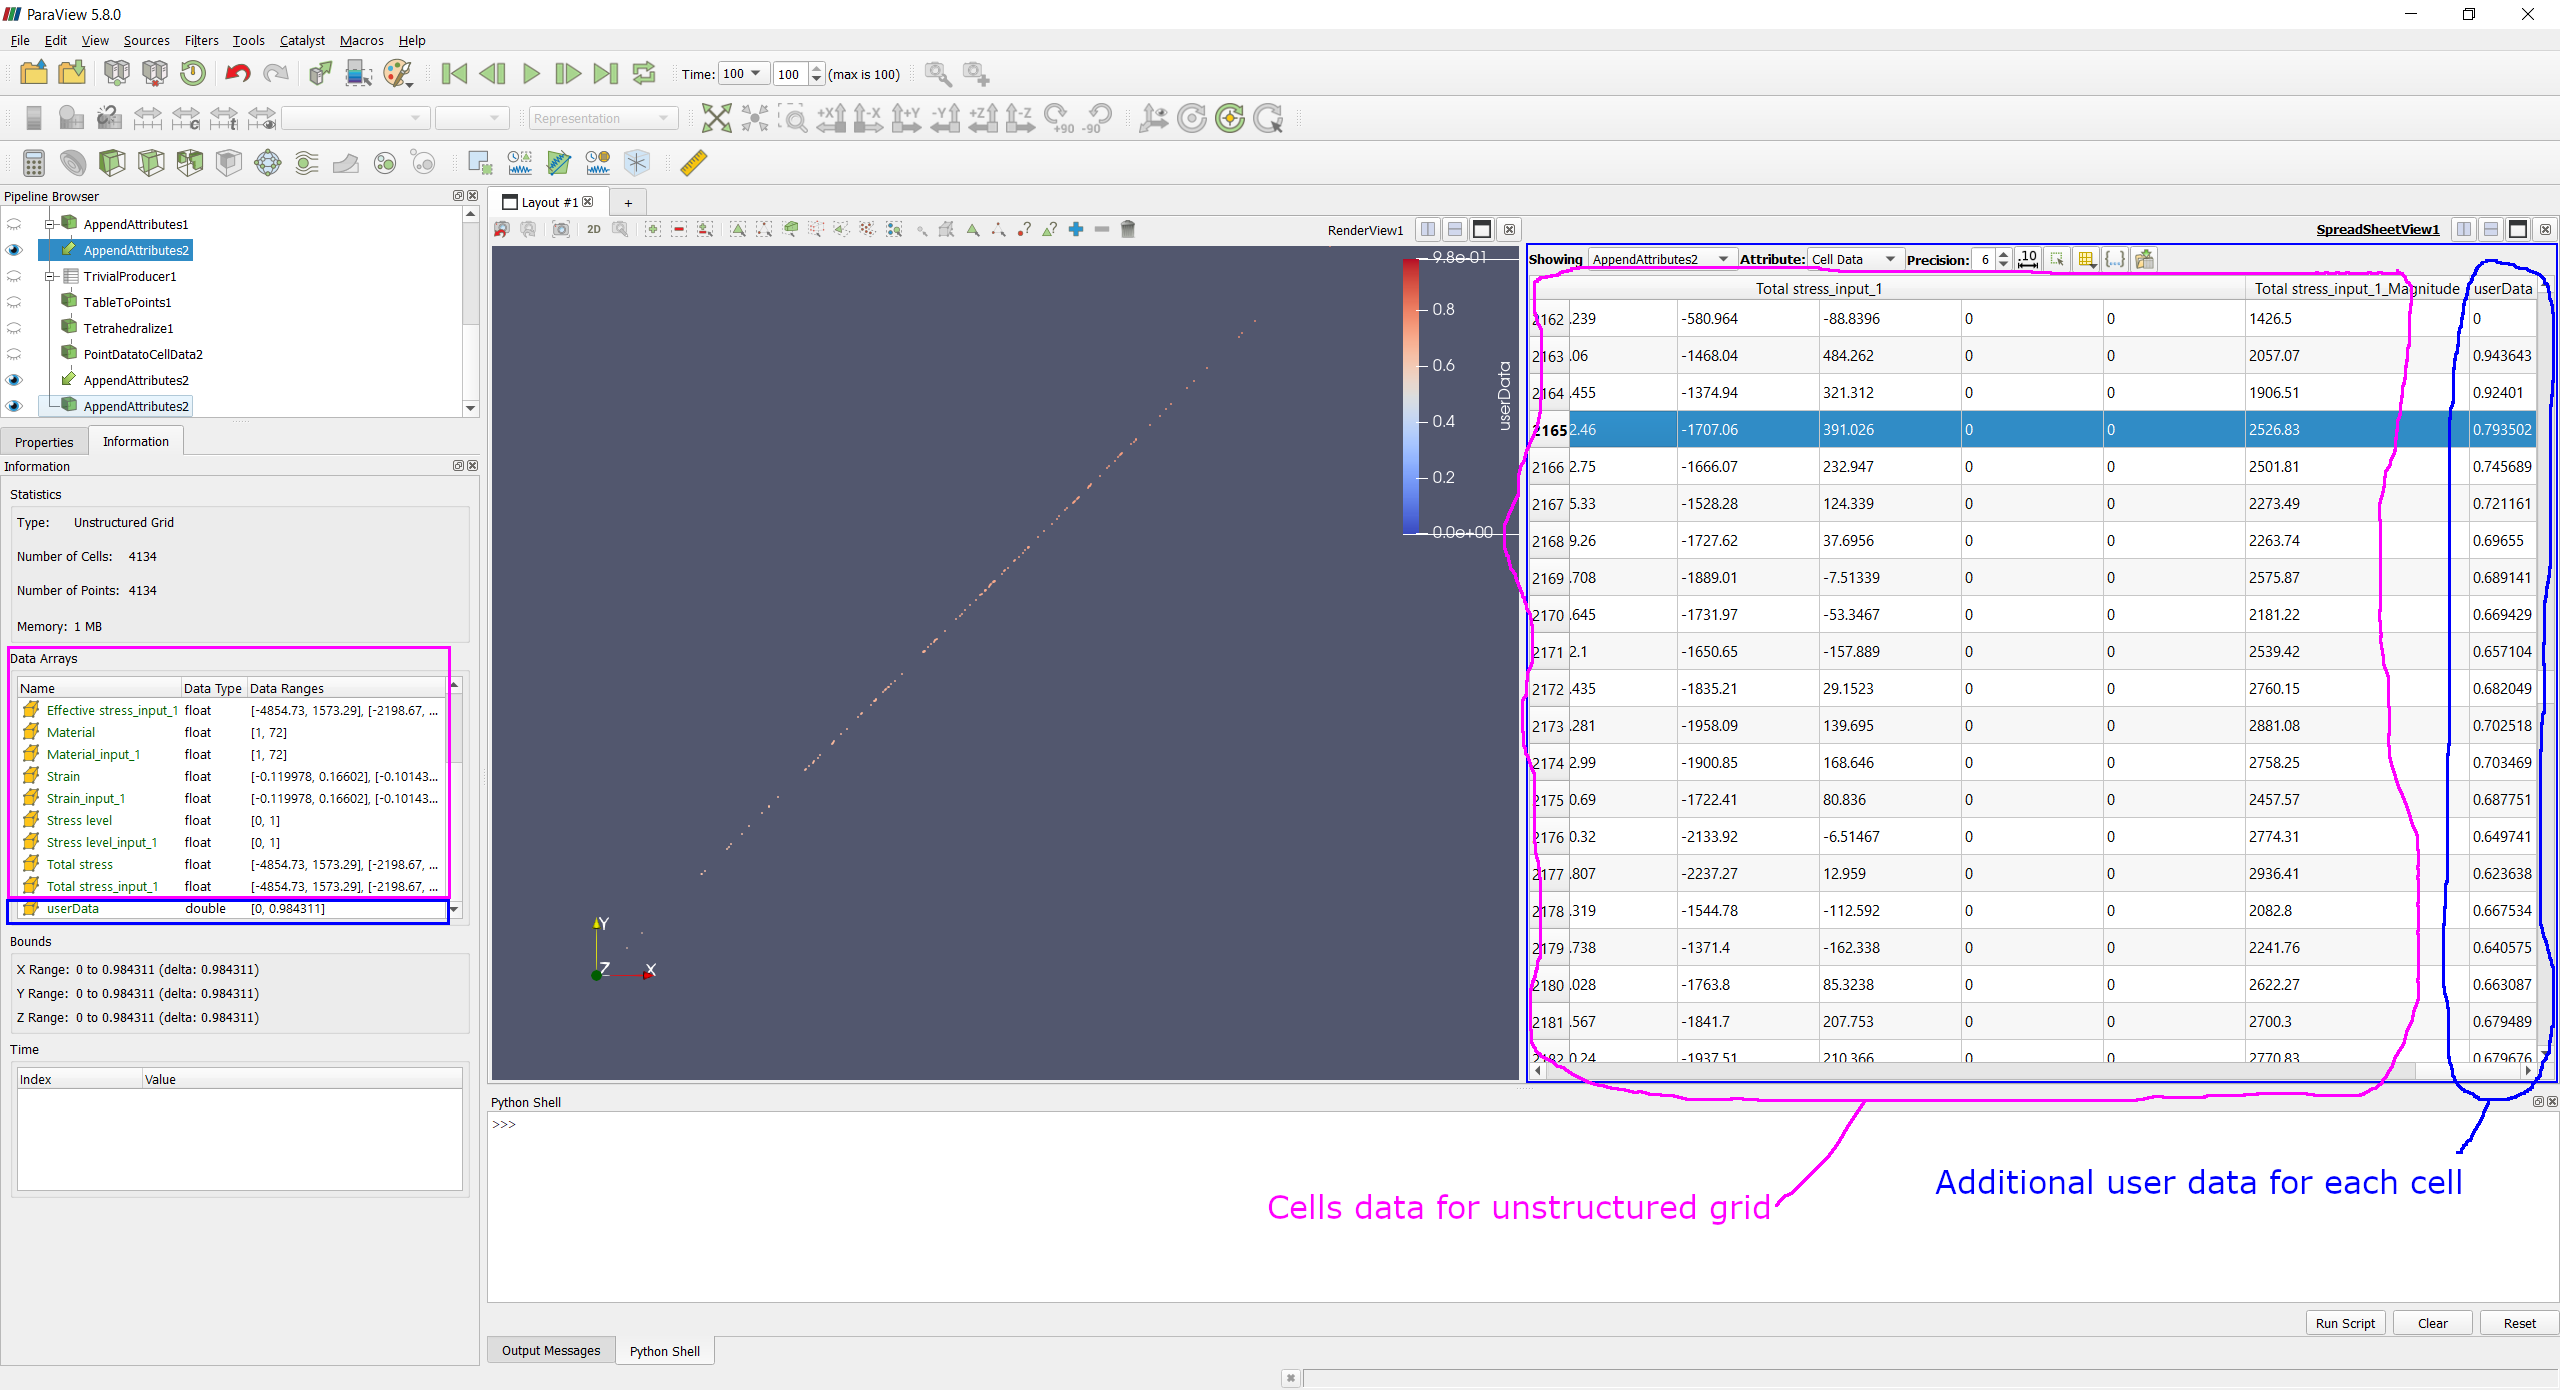
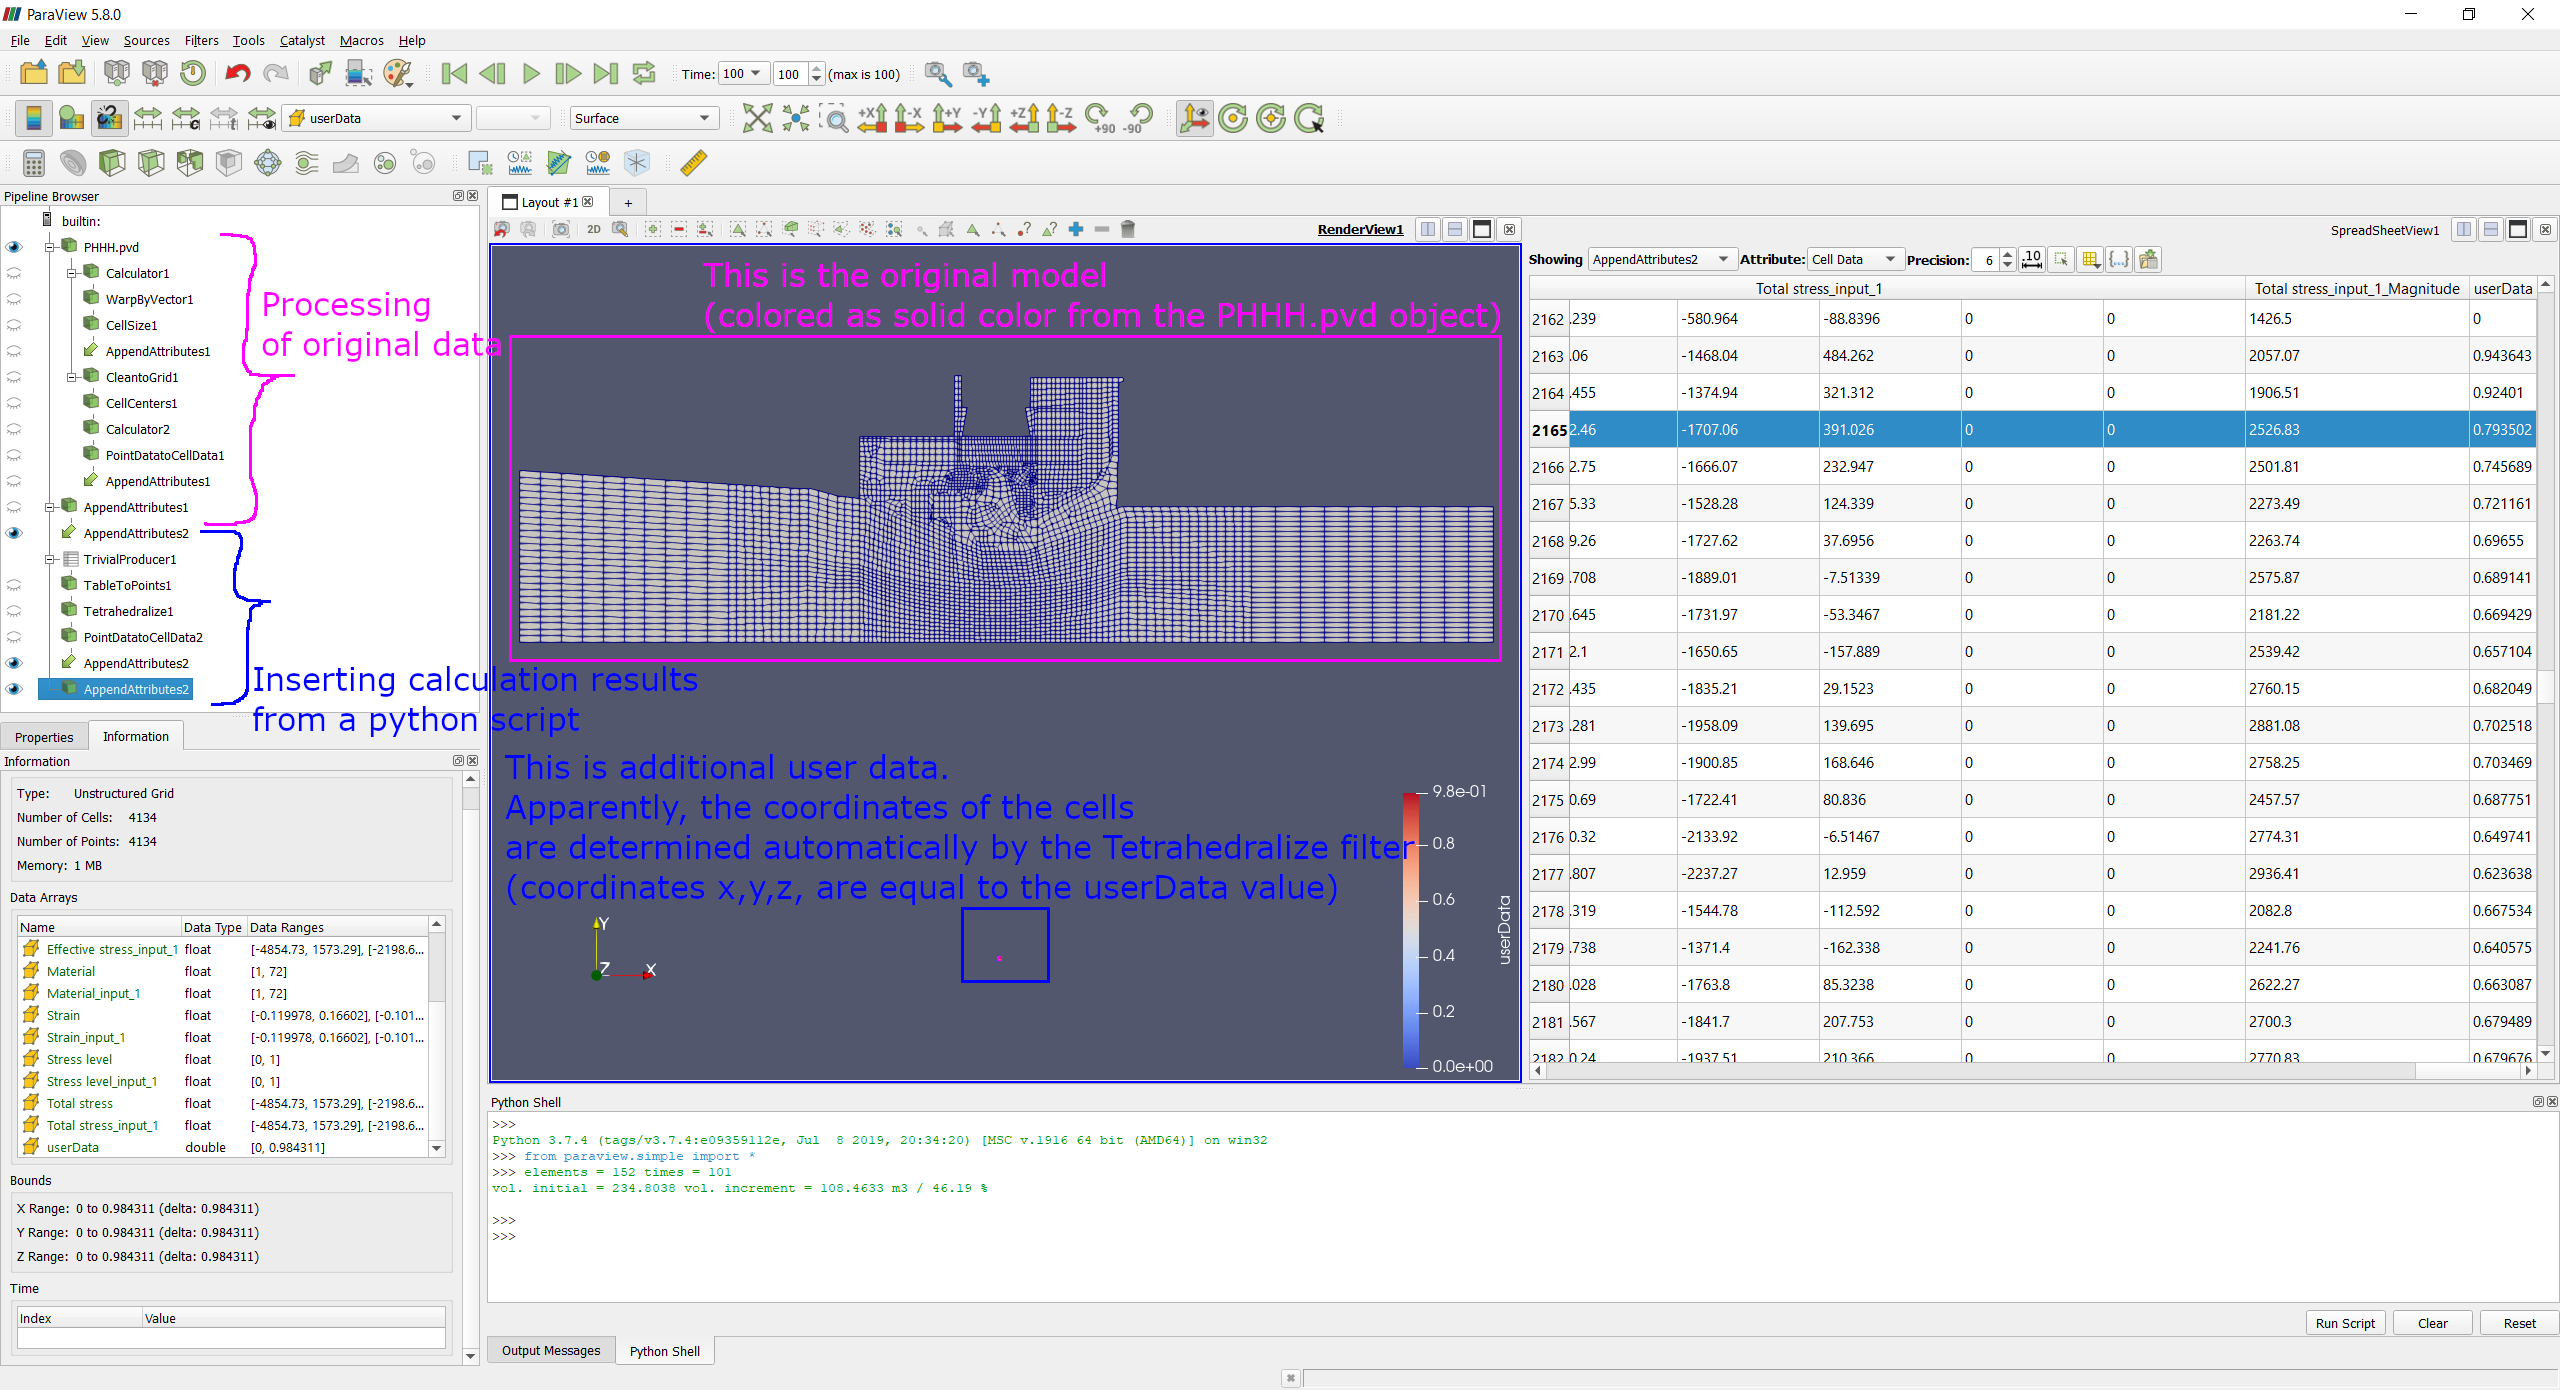
But how do I render the data on my unstructured grid? I transferred the data to the Pipeline Browser, and applied filters TableToPoints --> Tetrahedralize --> PointDataToCellData. But after appending the attributes, the data continue rendering separately from the target model. The imported data looks like this (as I understand it, external data is attached to the cells created by the Tetrahedralize filter)
But how do I make the additional user data appear on the original model. I see that user data are displayed separately on an artificially created additional model (representing a line of cells where the coordinates x,y,z are equal to the userData value). I see the following in the program
I think what is confusing us is that the Append Attributes filter should let you do what you want. What is probably the problem is that Append Attributes uses the “first” input for the geometry and only grabs the fields from subsequent inputs. So, when adding the Append Attributes, you first have to select the data from your pvd file, then select the data generated from your python script, and then add the Append Attributes filter.