Problems with Catalyst2 and Paraview Live Visualization

Hello!

I recently started taking a closer look into implementing Catalyst2 capabilities into an in-house fluid dynamics solver.

My main goal is to be able to have a live representation of the solution, which means loading up a Catalyst state with predefined filters (Slices, Calculators etc) and have the ParaView windows automatically update with the new flow characteristics.

I started with this guide:

I faced the same problem mentioned in the following comment of the aforementioned guide:

which I also managed to solve by downloading and building ParaView from source.

Up to that point:

  • Catalyst is built correctly, tests are passed succesfully
  • ParaView is also build correctly, binaries work as intended

I then tried some of the examples.

Catalyst examples (legacy)

All examples work as intended.
I am able to connect ParaView to the simulation and visualize whatever I want.
Catalyst breakpoints also work as intended.
All and all, legacy Catalyst examples work just fine.
Therefore, I think my ParaView and Catalyst builds are OK.

Catalyst2 examples

I tried the CxxFullExample that is mentioned in the guide.

I compiled the example using:

cmake -DCMAKE_PREFIX_PATH=#ParaViewBuildPath# #exampleSourcePath#
make

It is built succesfully.

In order to run the example, I also needed to set:

export CATALYST_IMPLEMENTATION_PATHS=“#ParaviewBuildPath#/lib/catalyst”
export CATALYST_IMPLEMENTATION_NAME=paraview

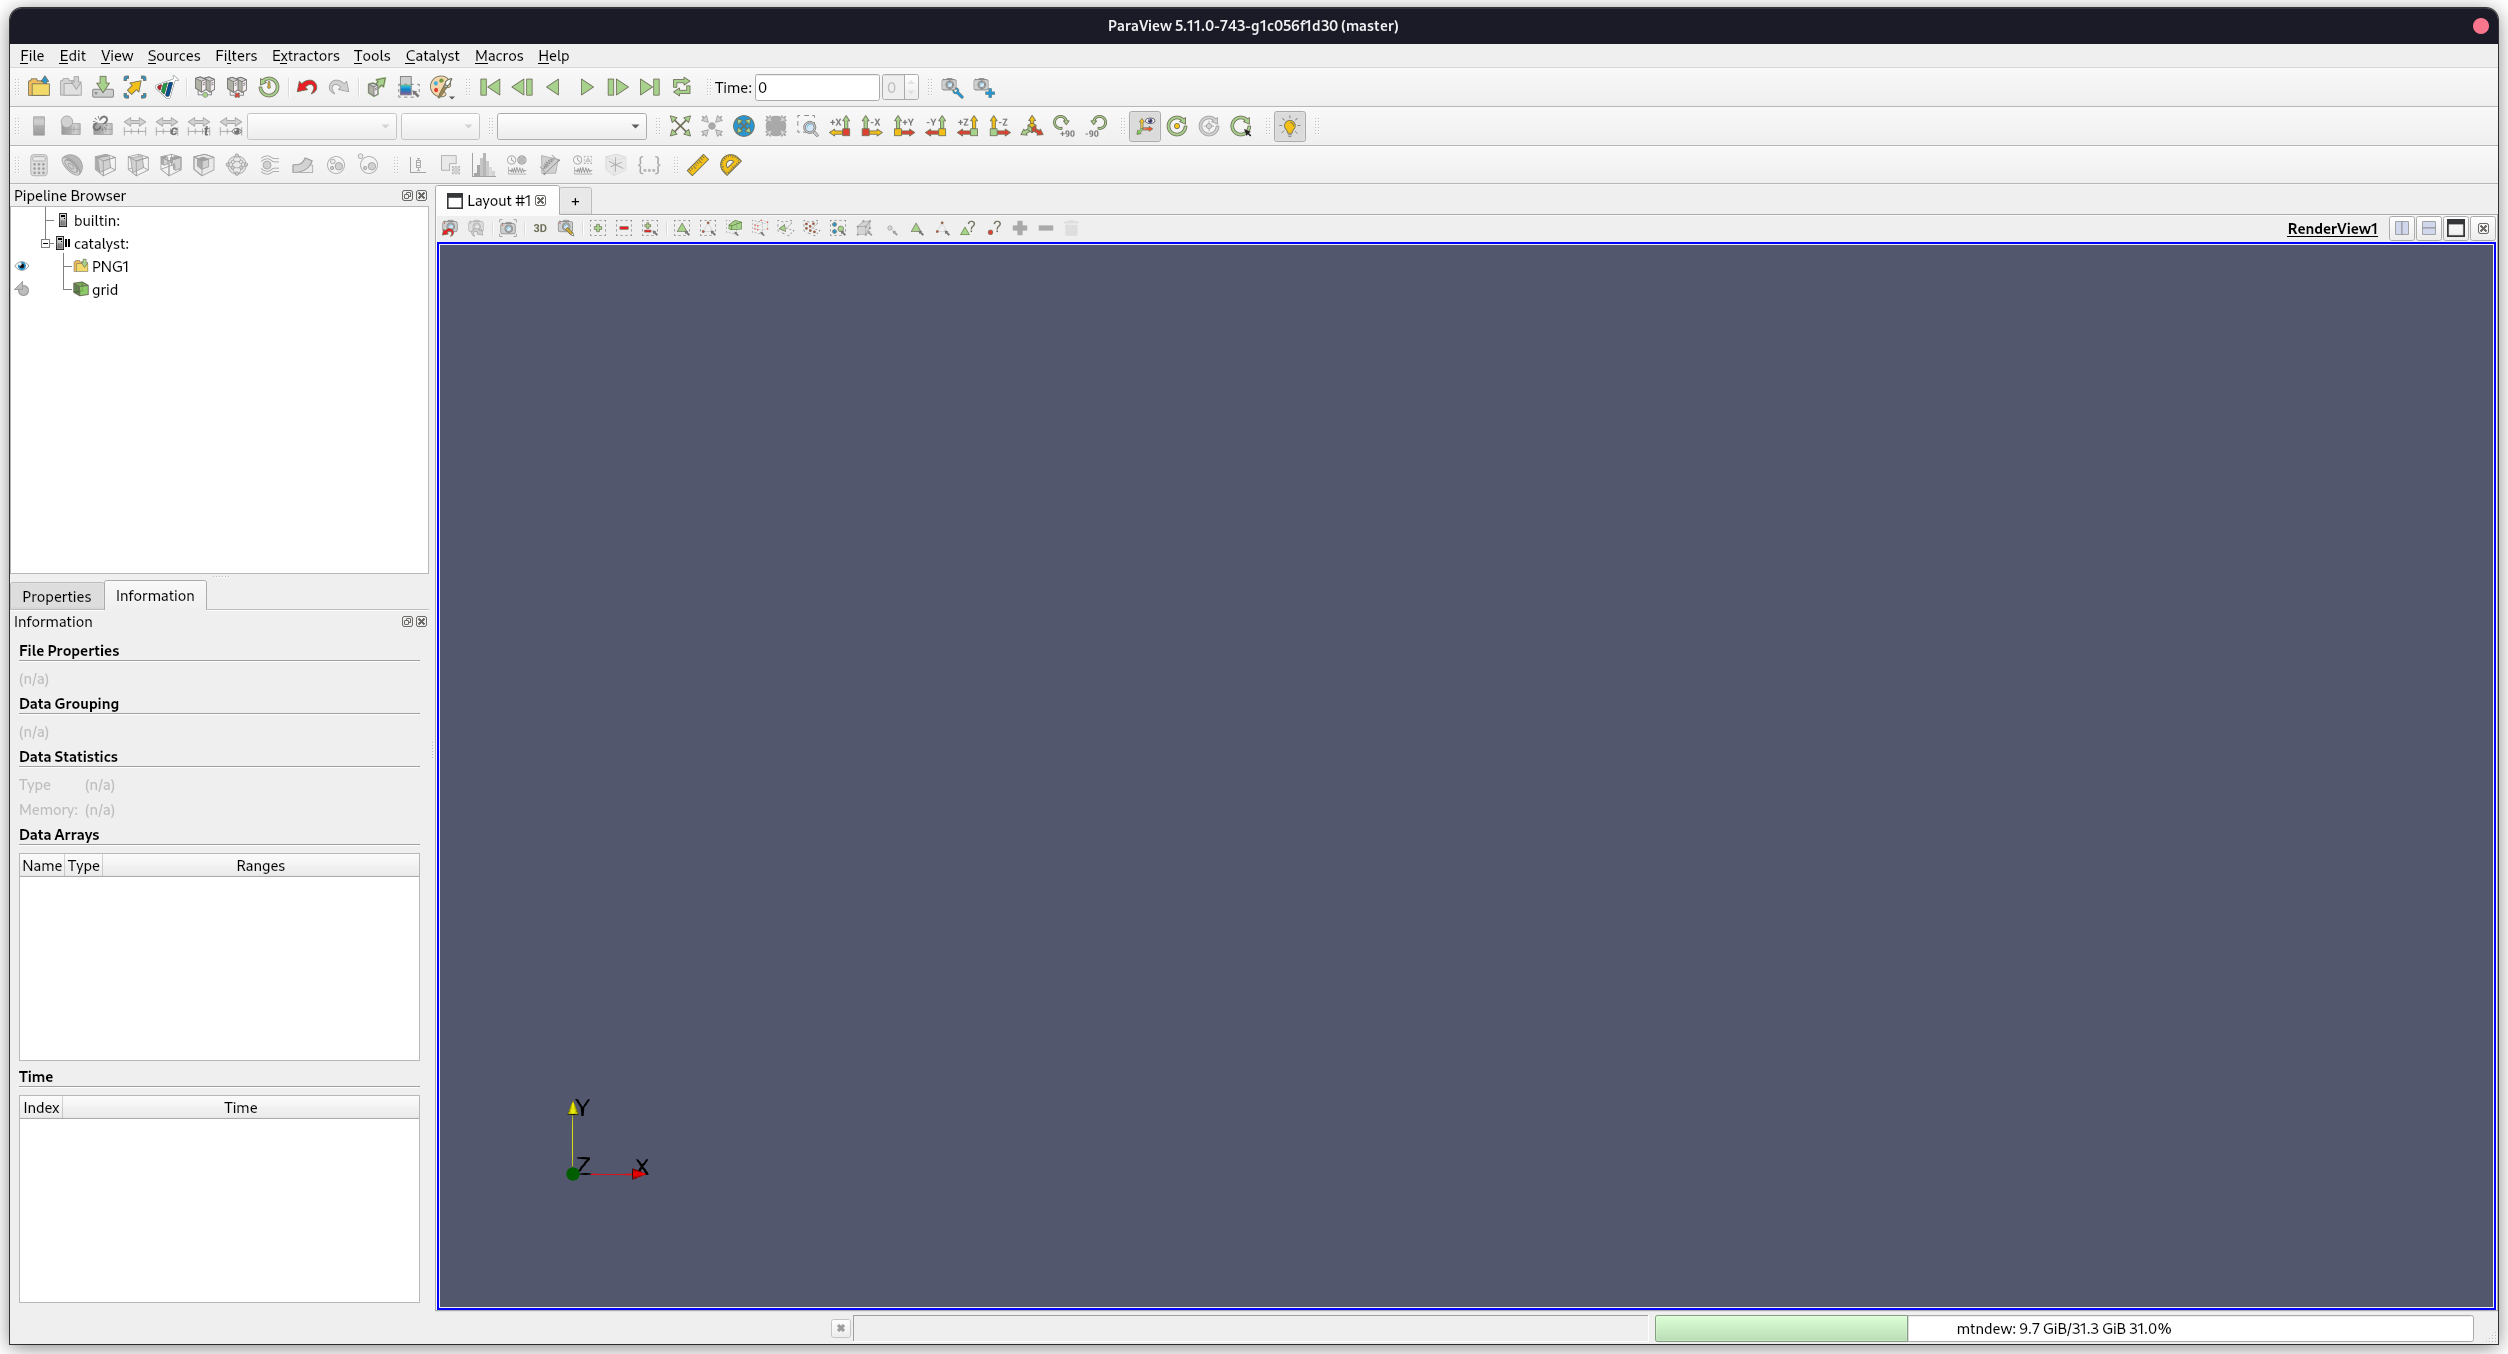
I then open ParaView and connect it to catalyst, also setting in to pause on the first iteration,
and run the example with:

./bin/CxxFullExampleV2 catalyst2_pipeline.py

ParaView connects to catalyst successfully:

The simulation also pauses on the first iteration, with a warning:
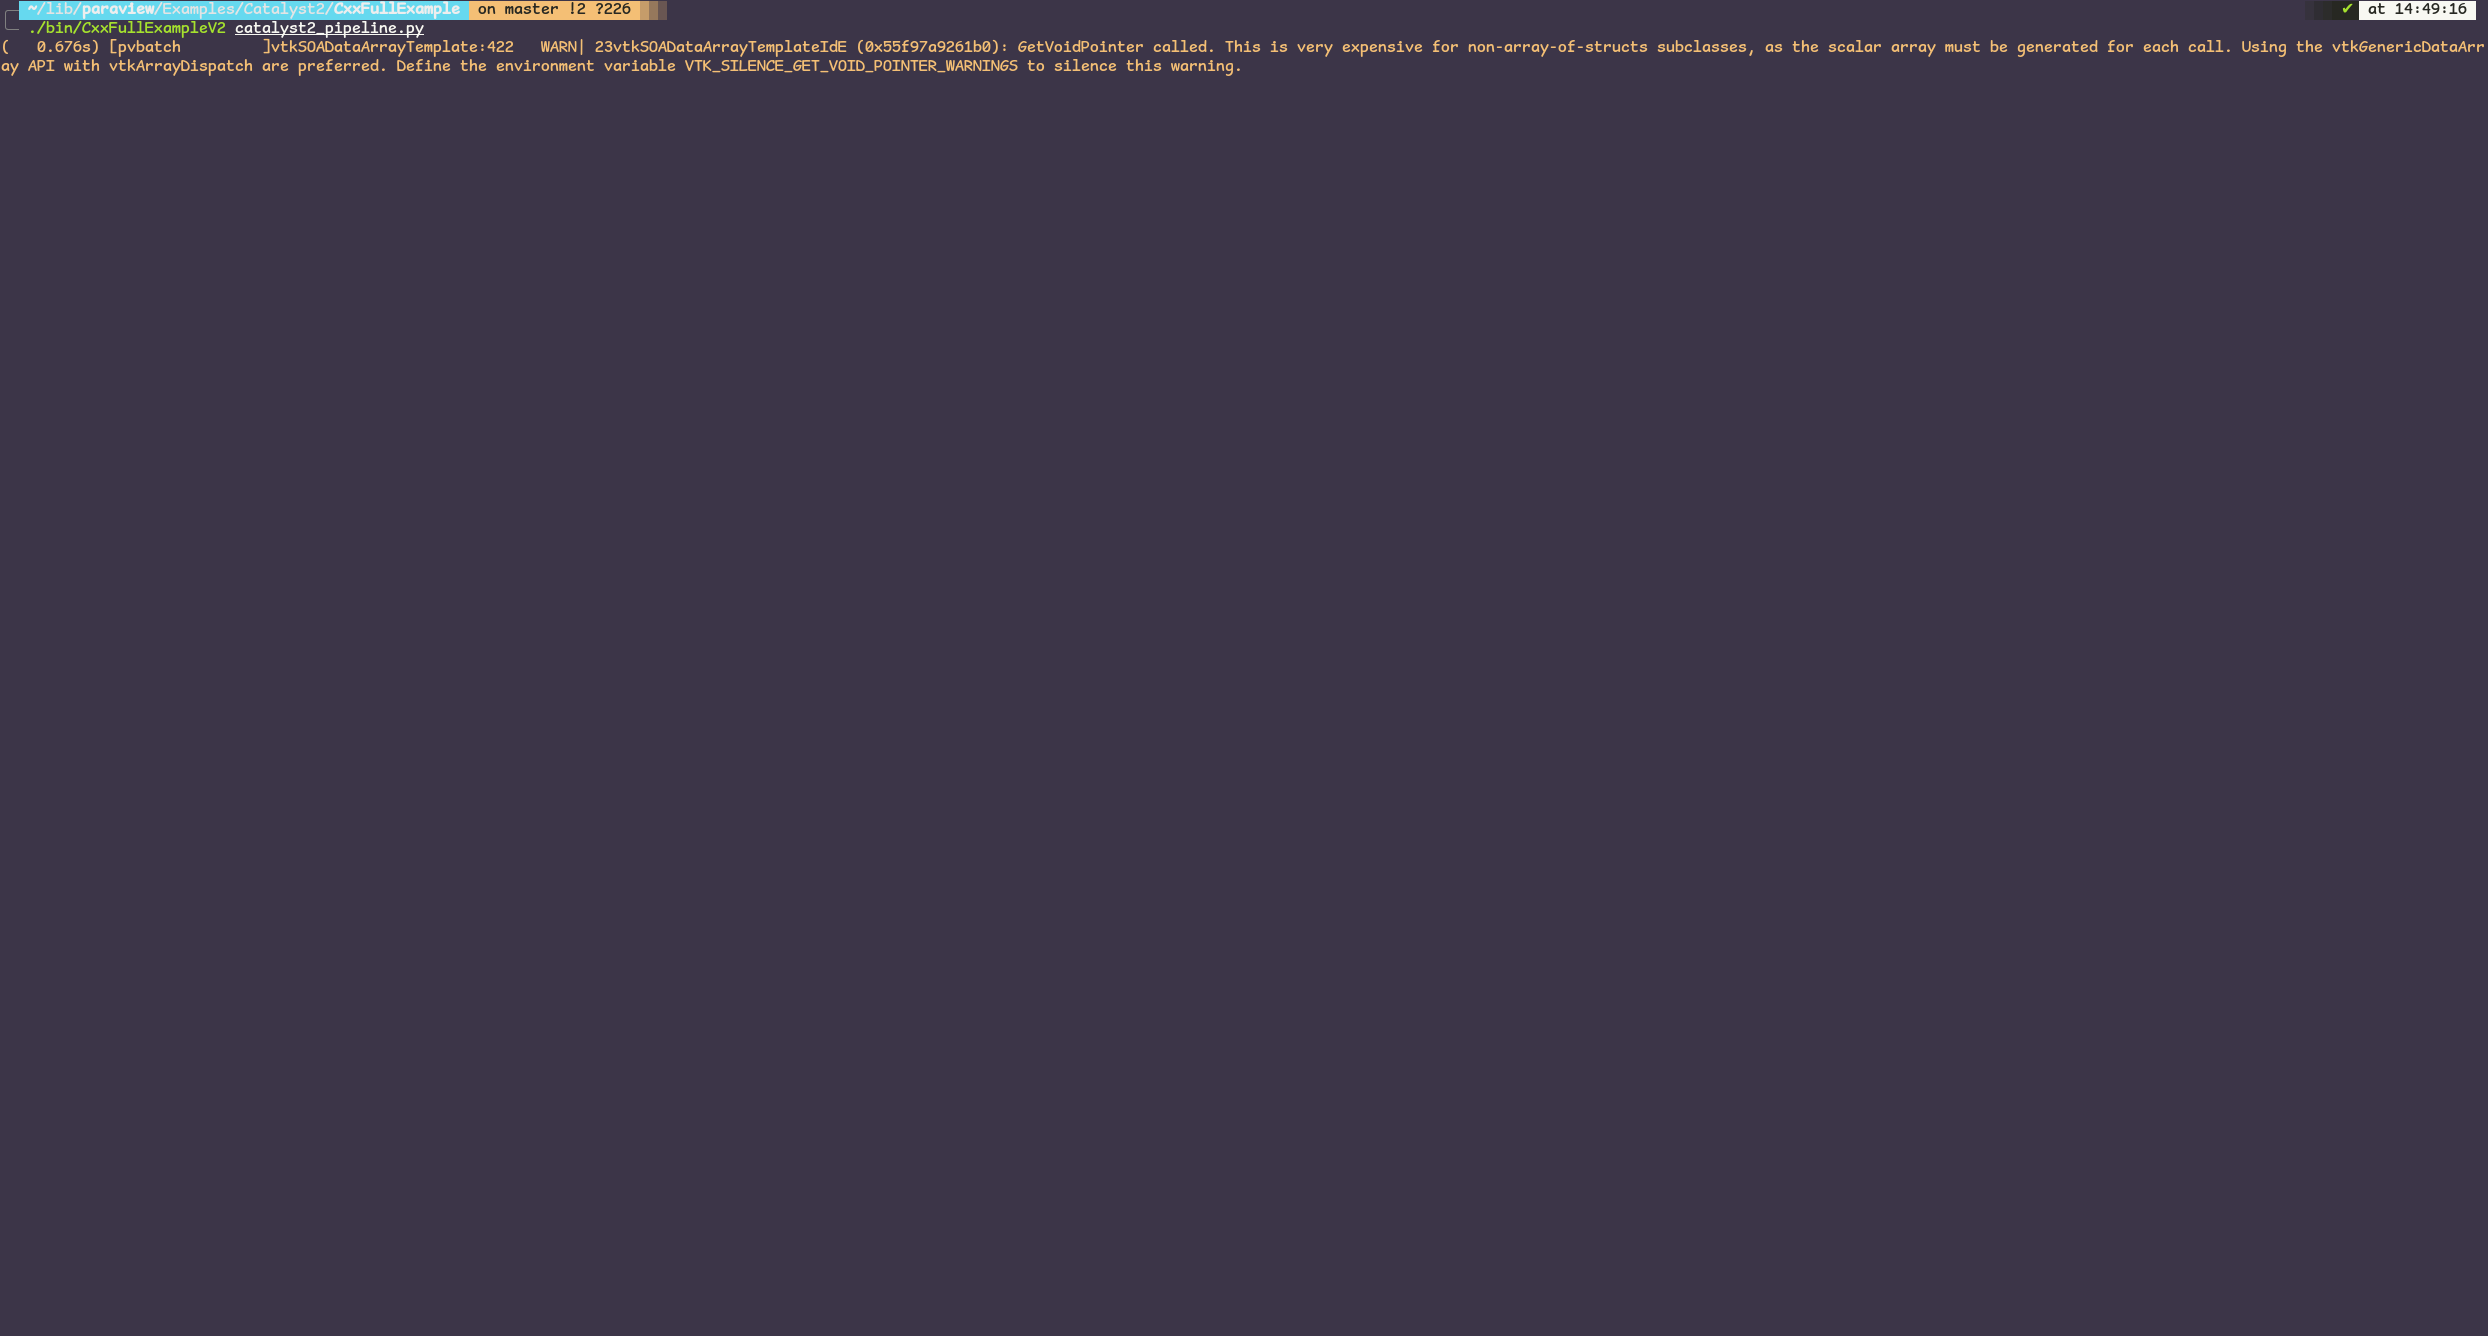
The warning reads:

GetVoidPointer called. This is very expensive for non-array-of-structs subclasses, as the scalar array must be generated for each call. Using the vtkGenericDataArray API with vtkArrayDispatch are preferred. Define the environment variable VTK_SILENCE_GET_VOID_POINTER_WARNINGS to silence this warning.

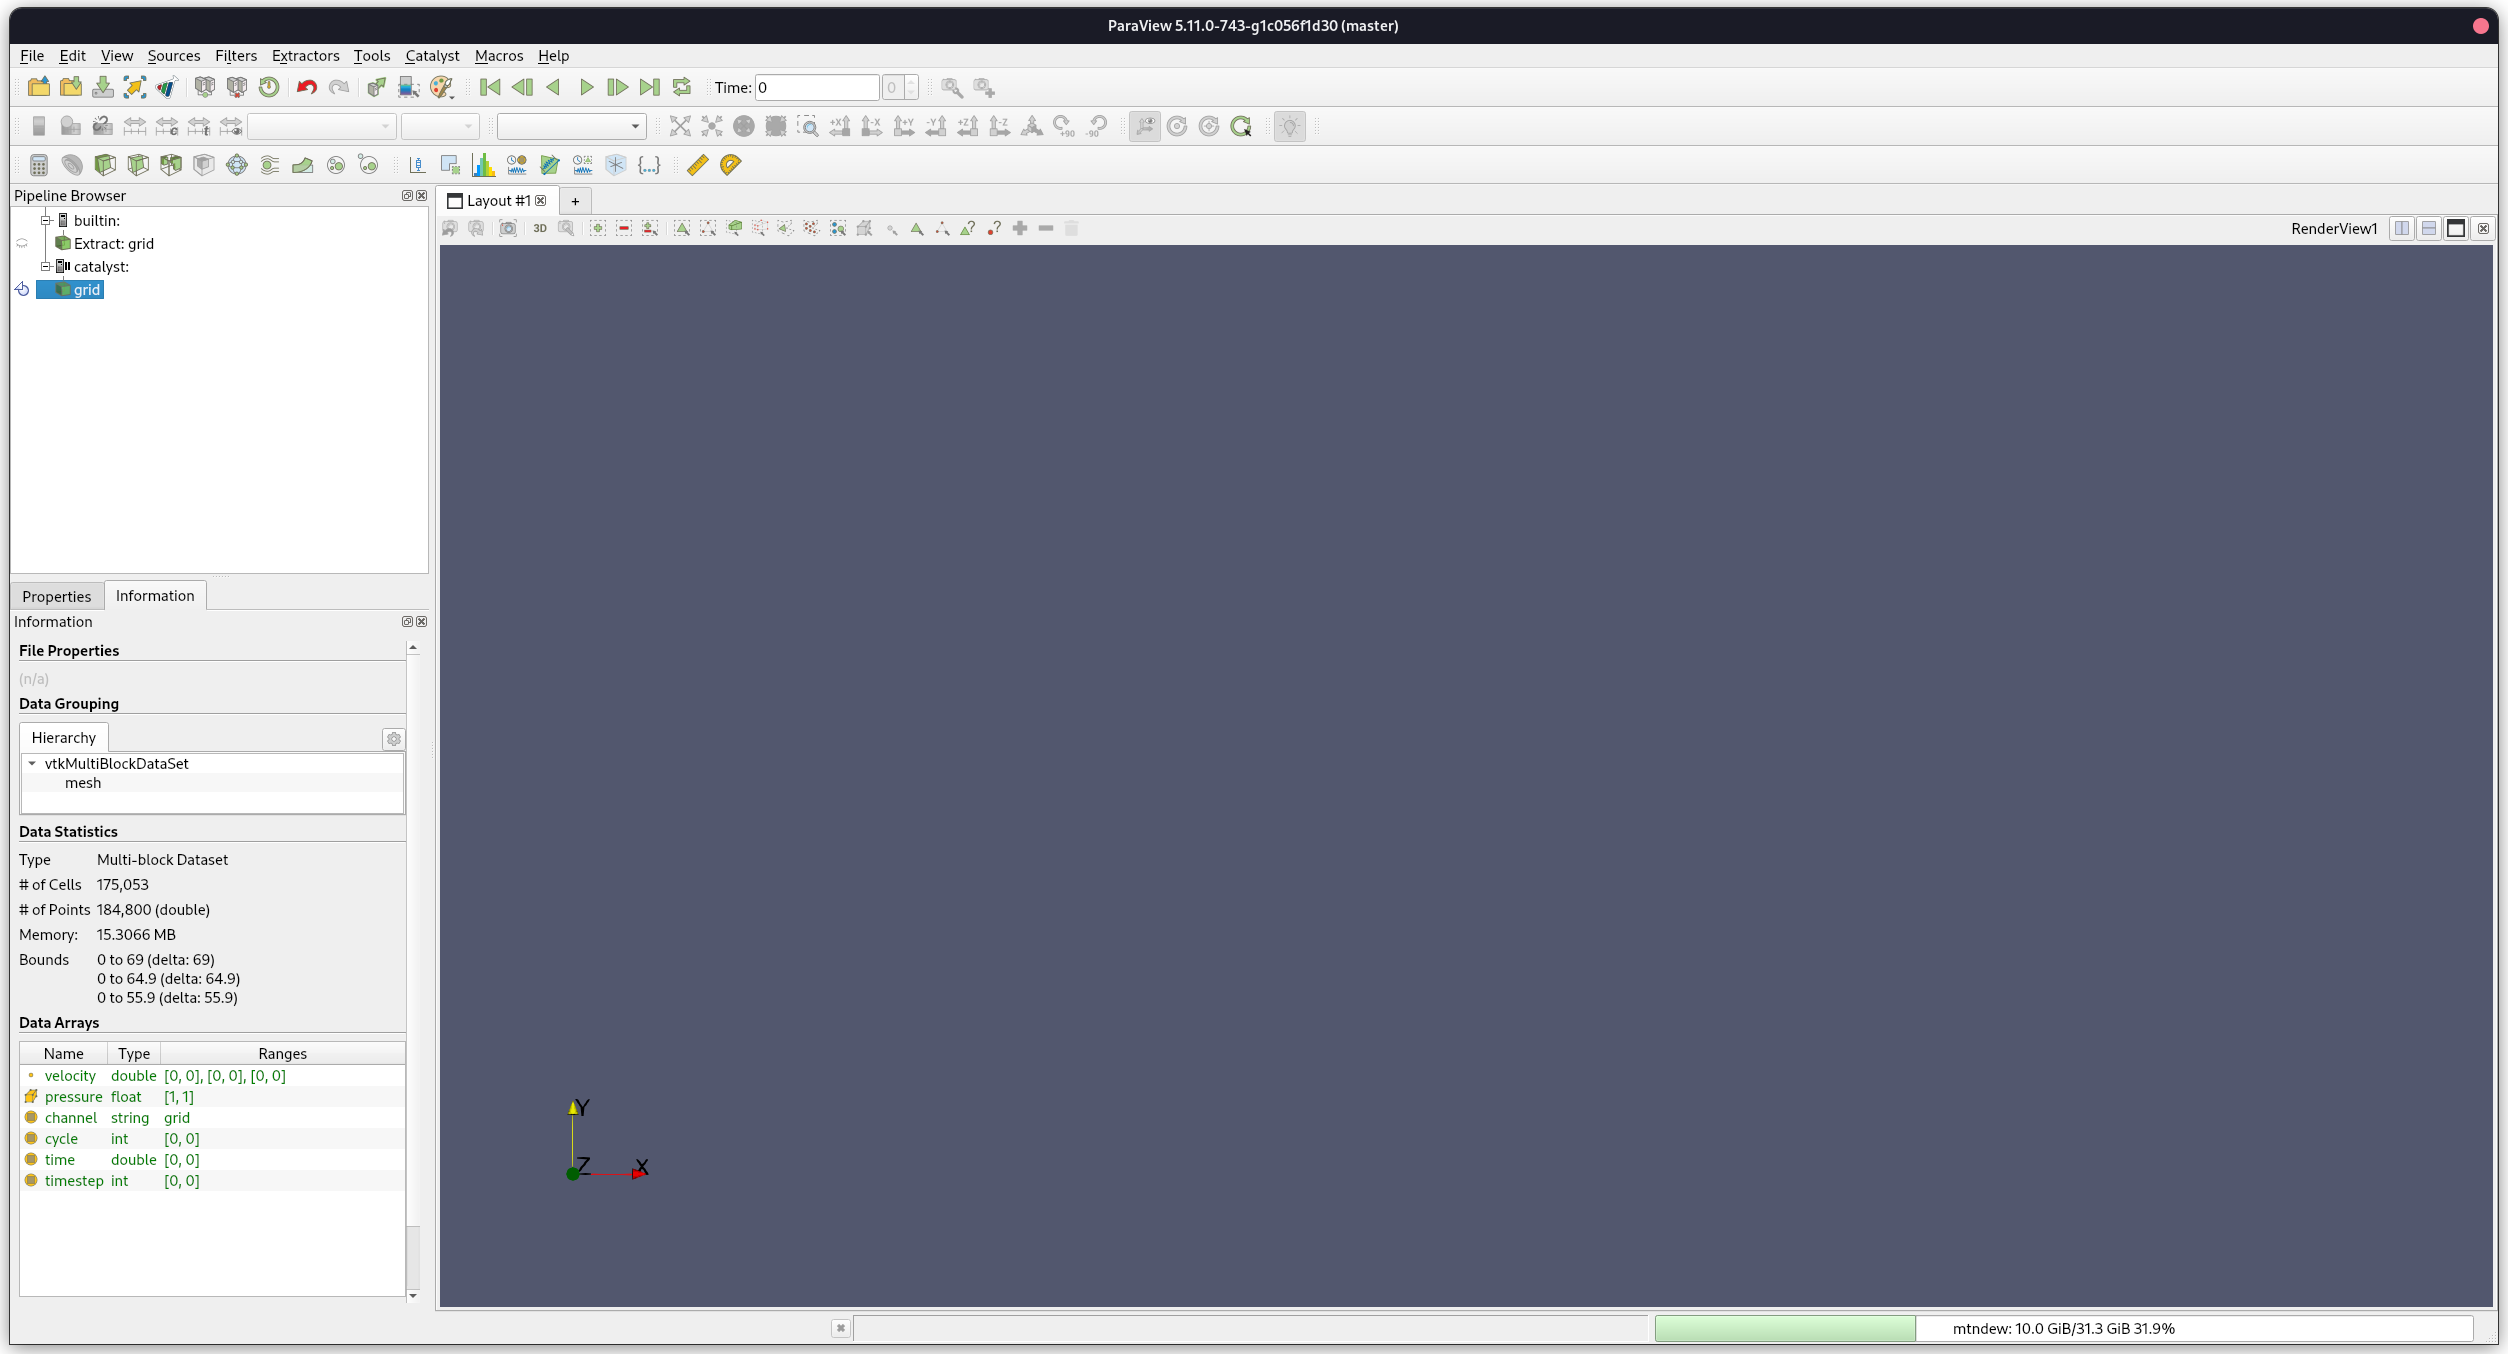
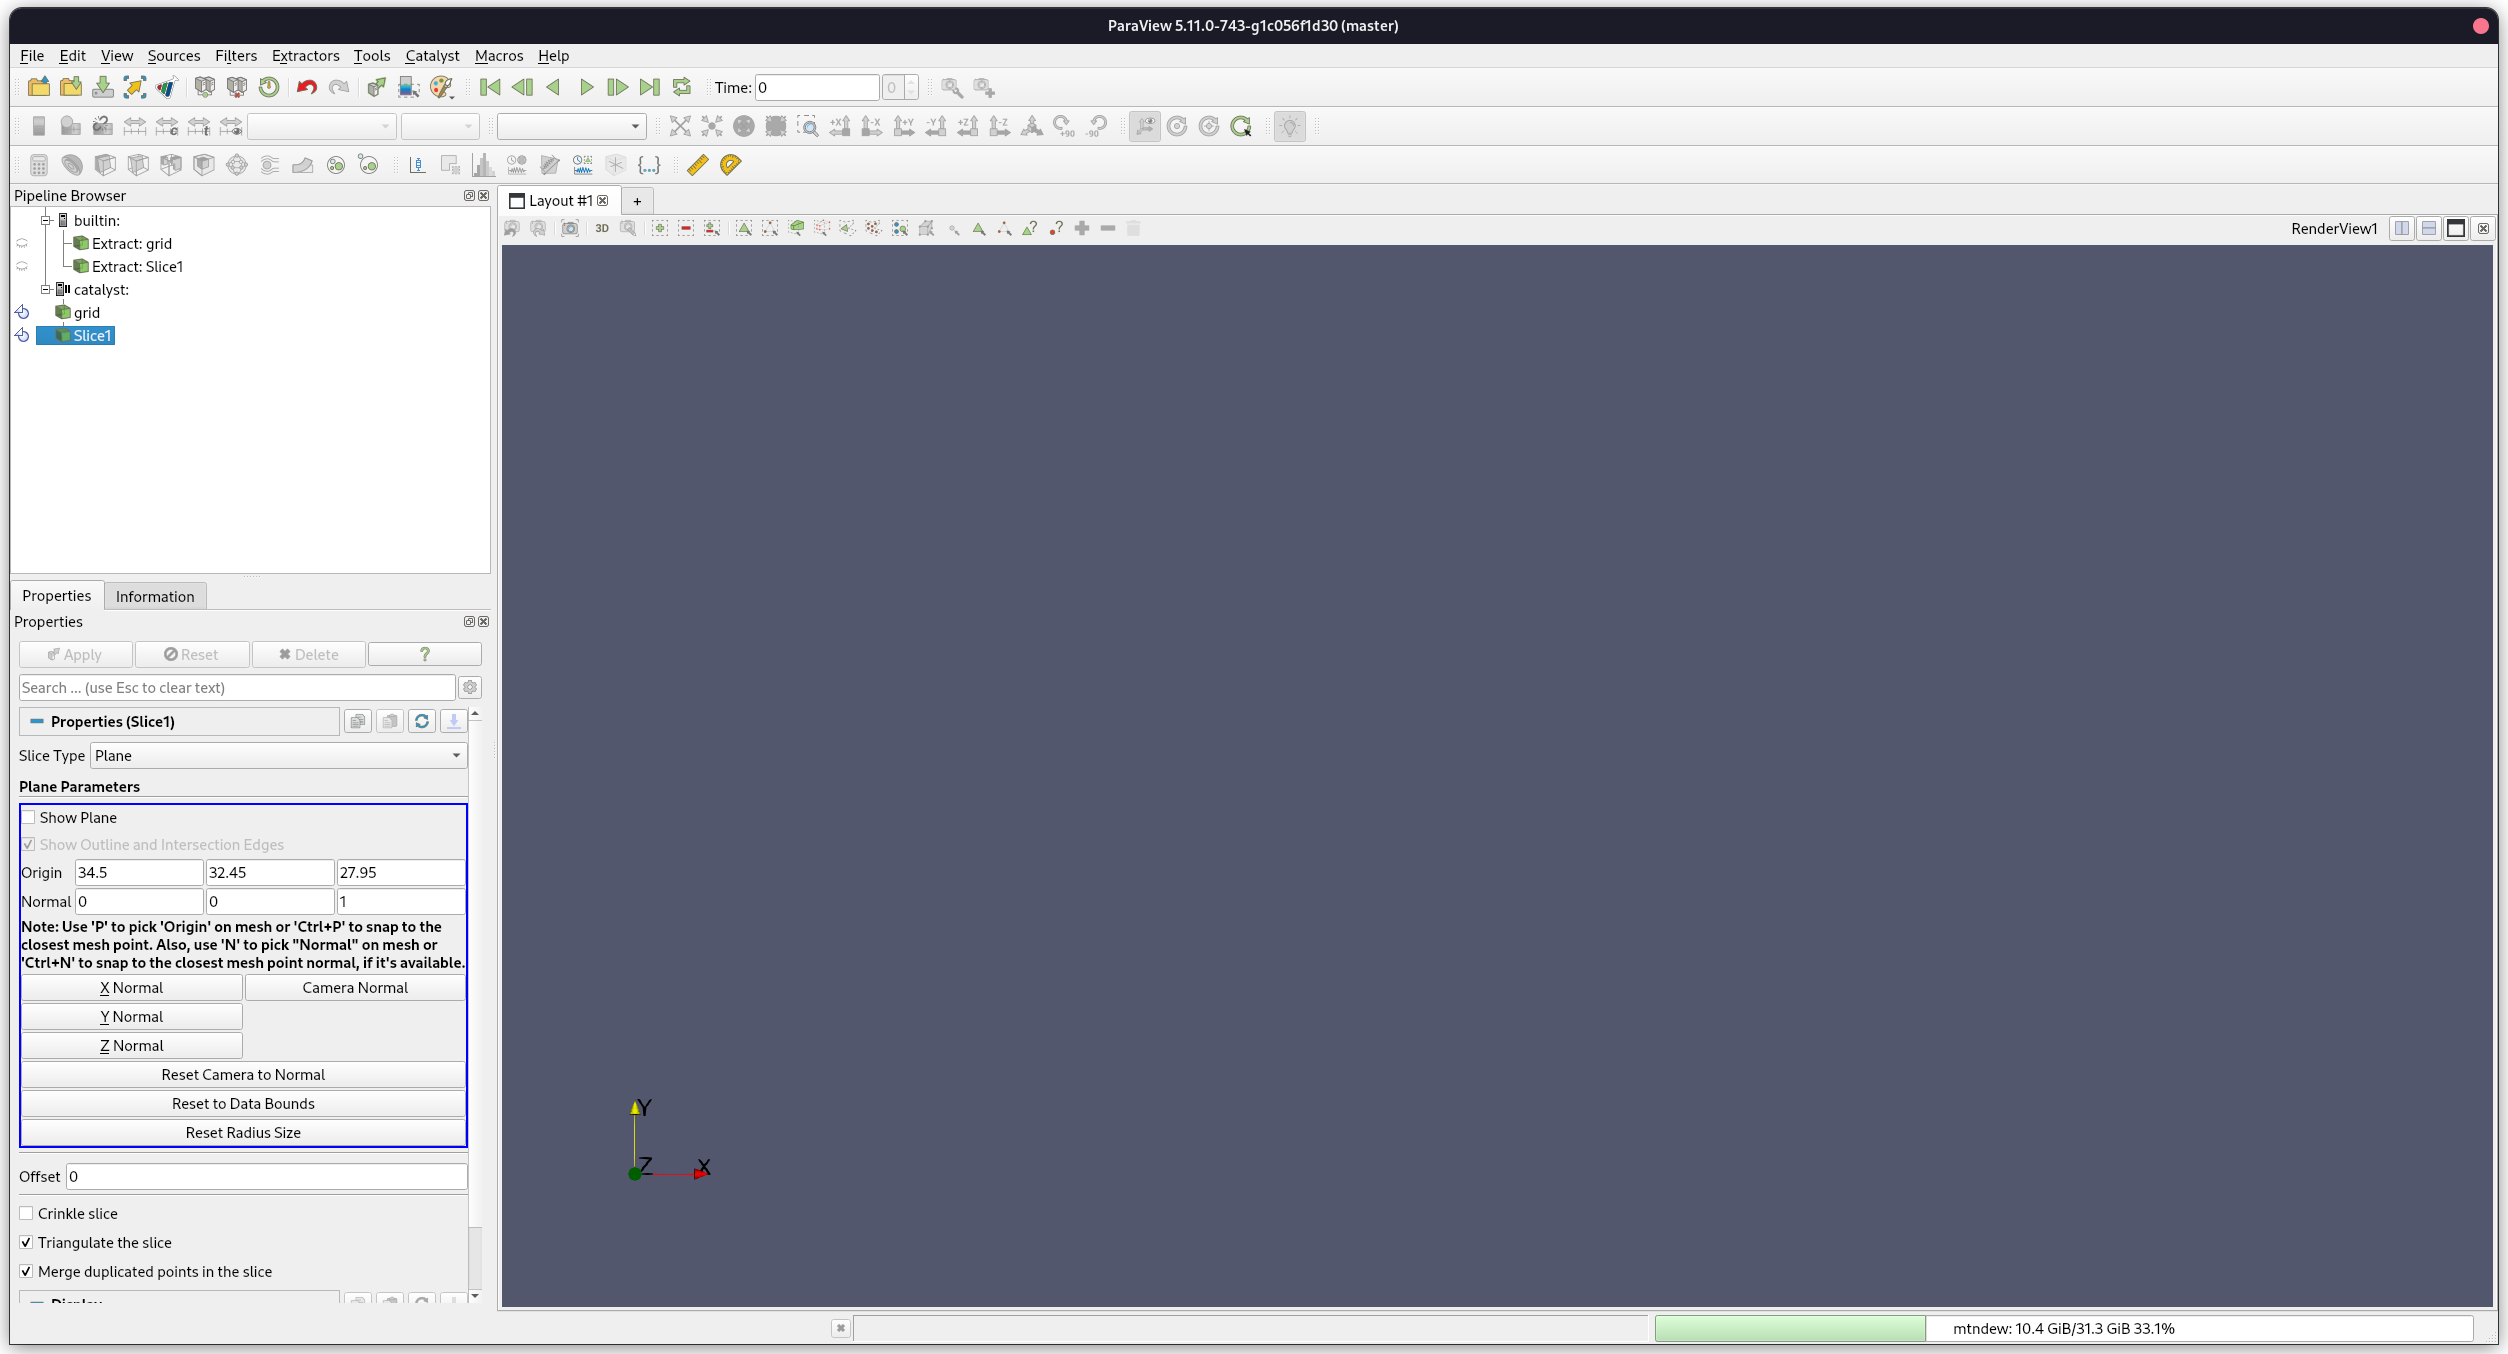
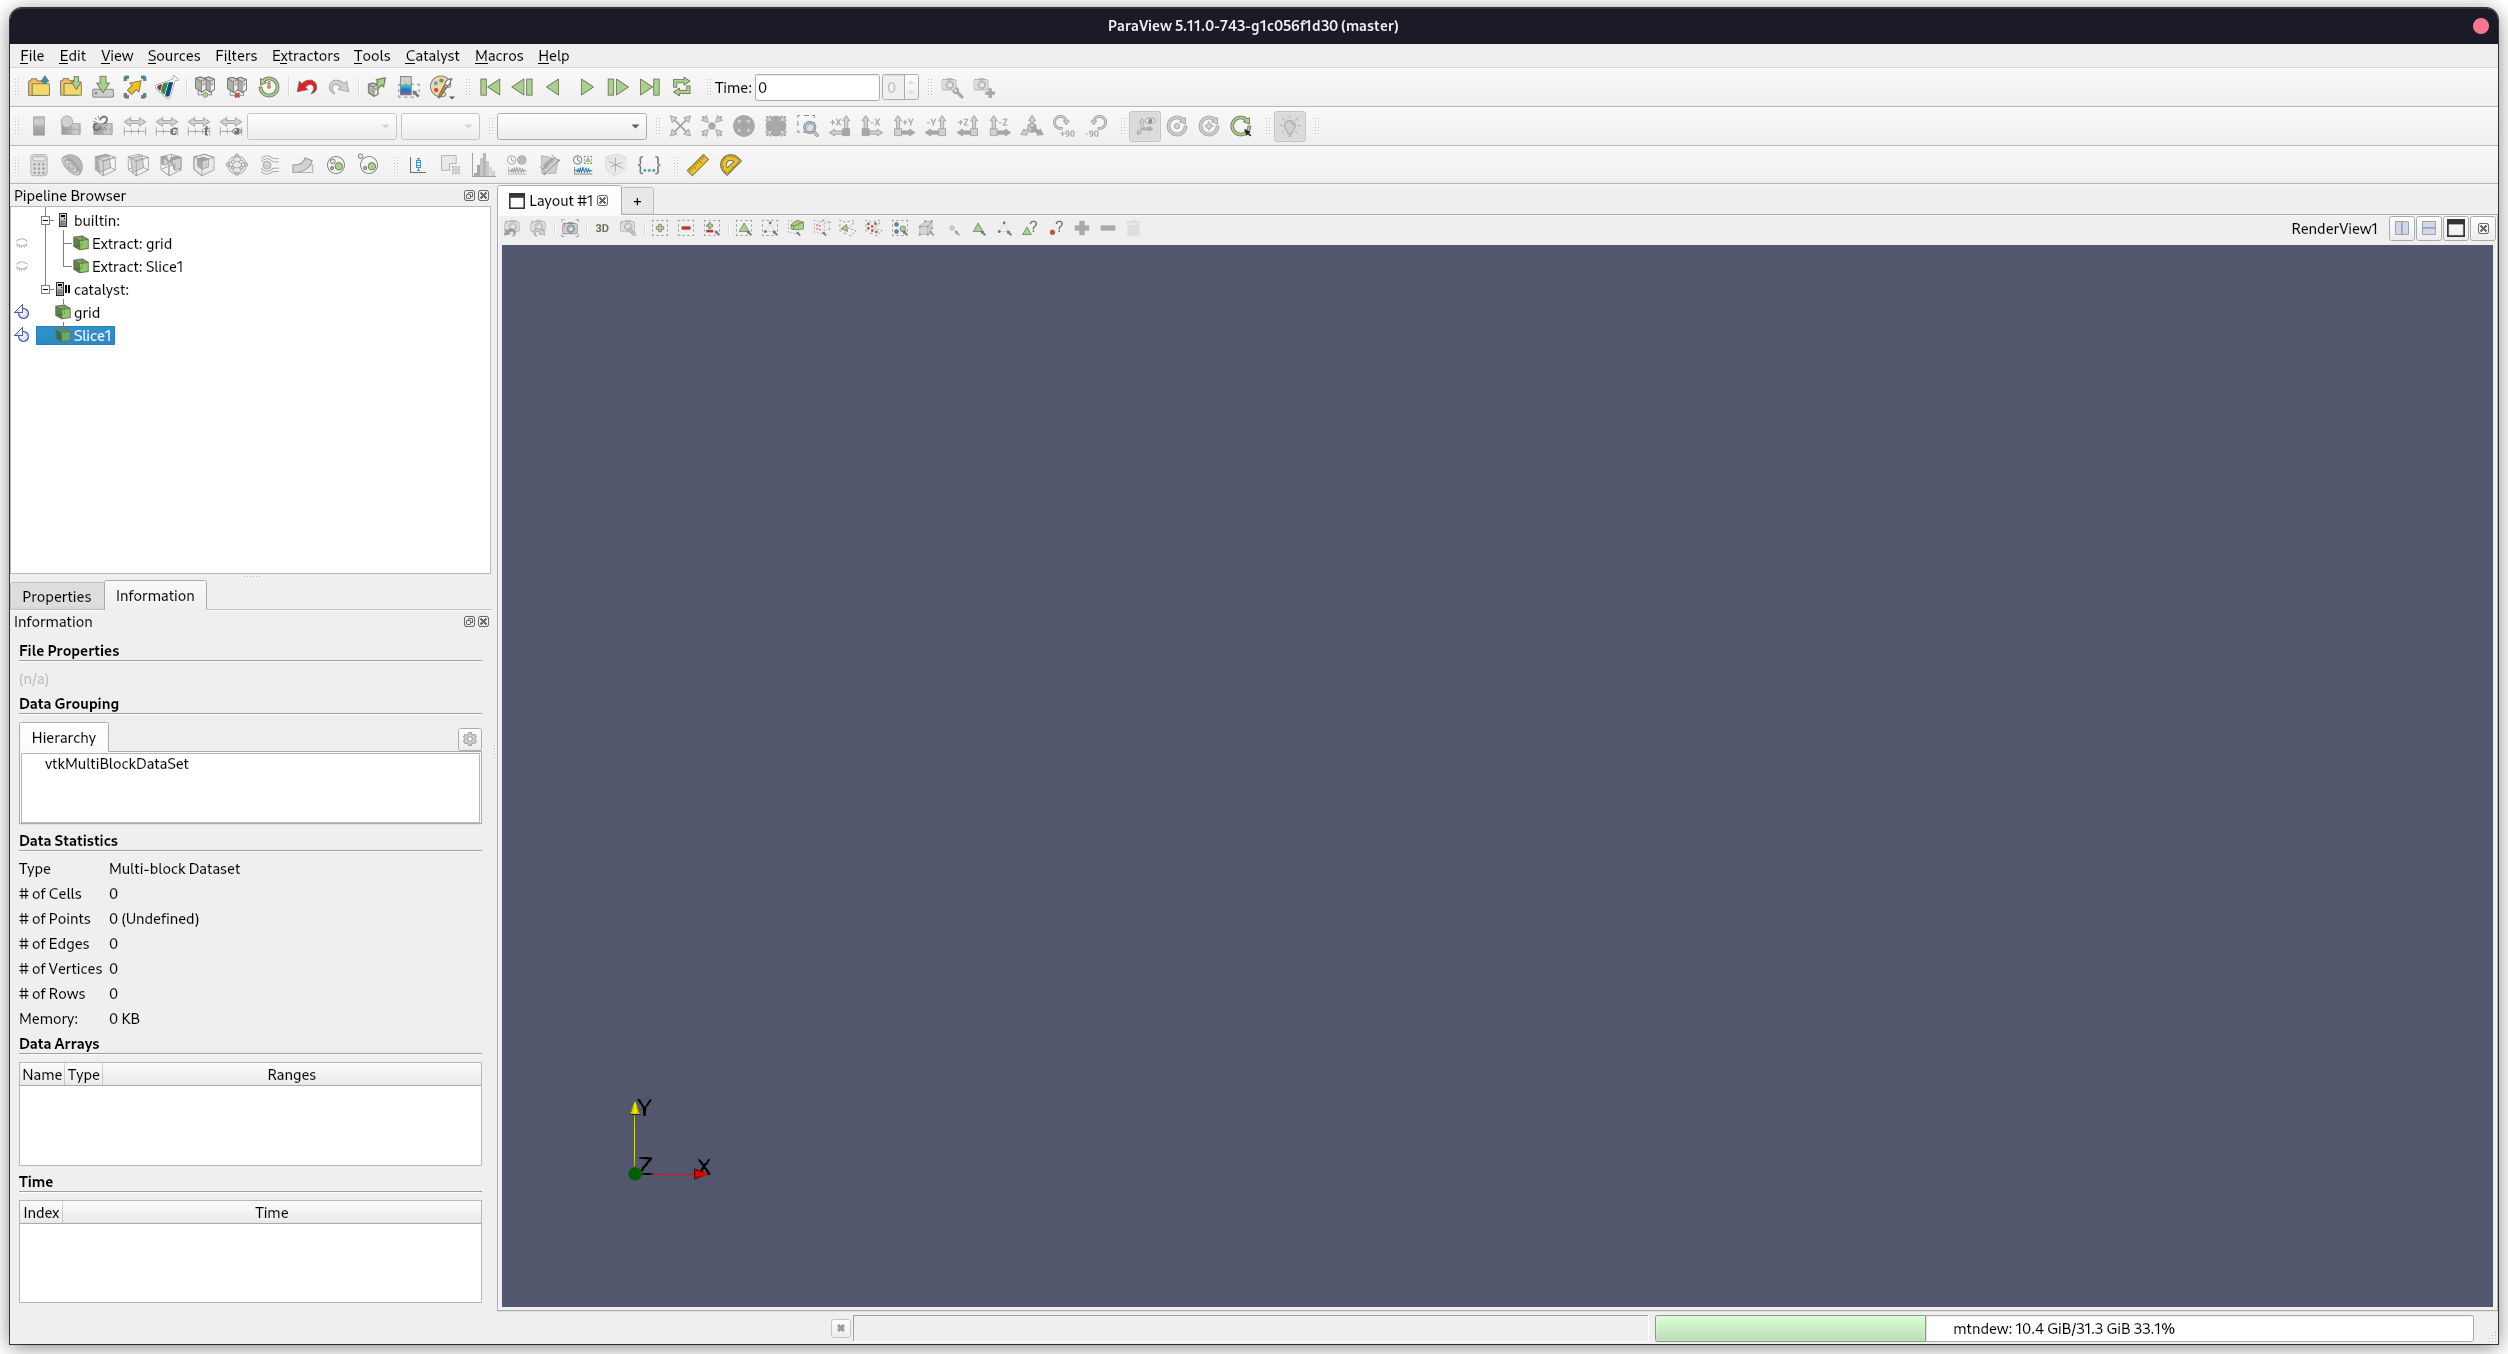
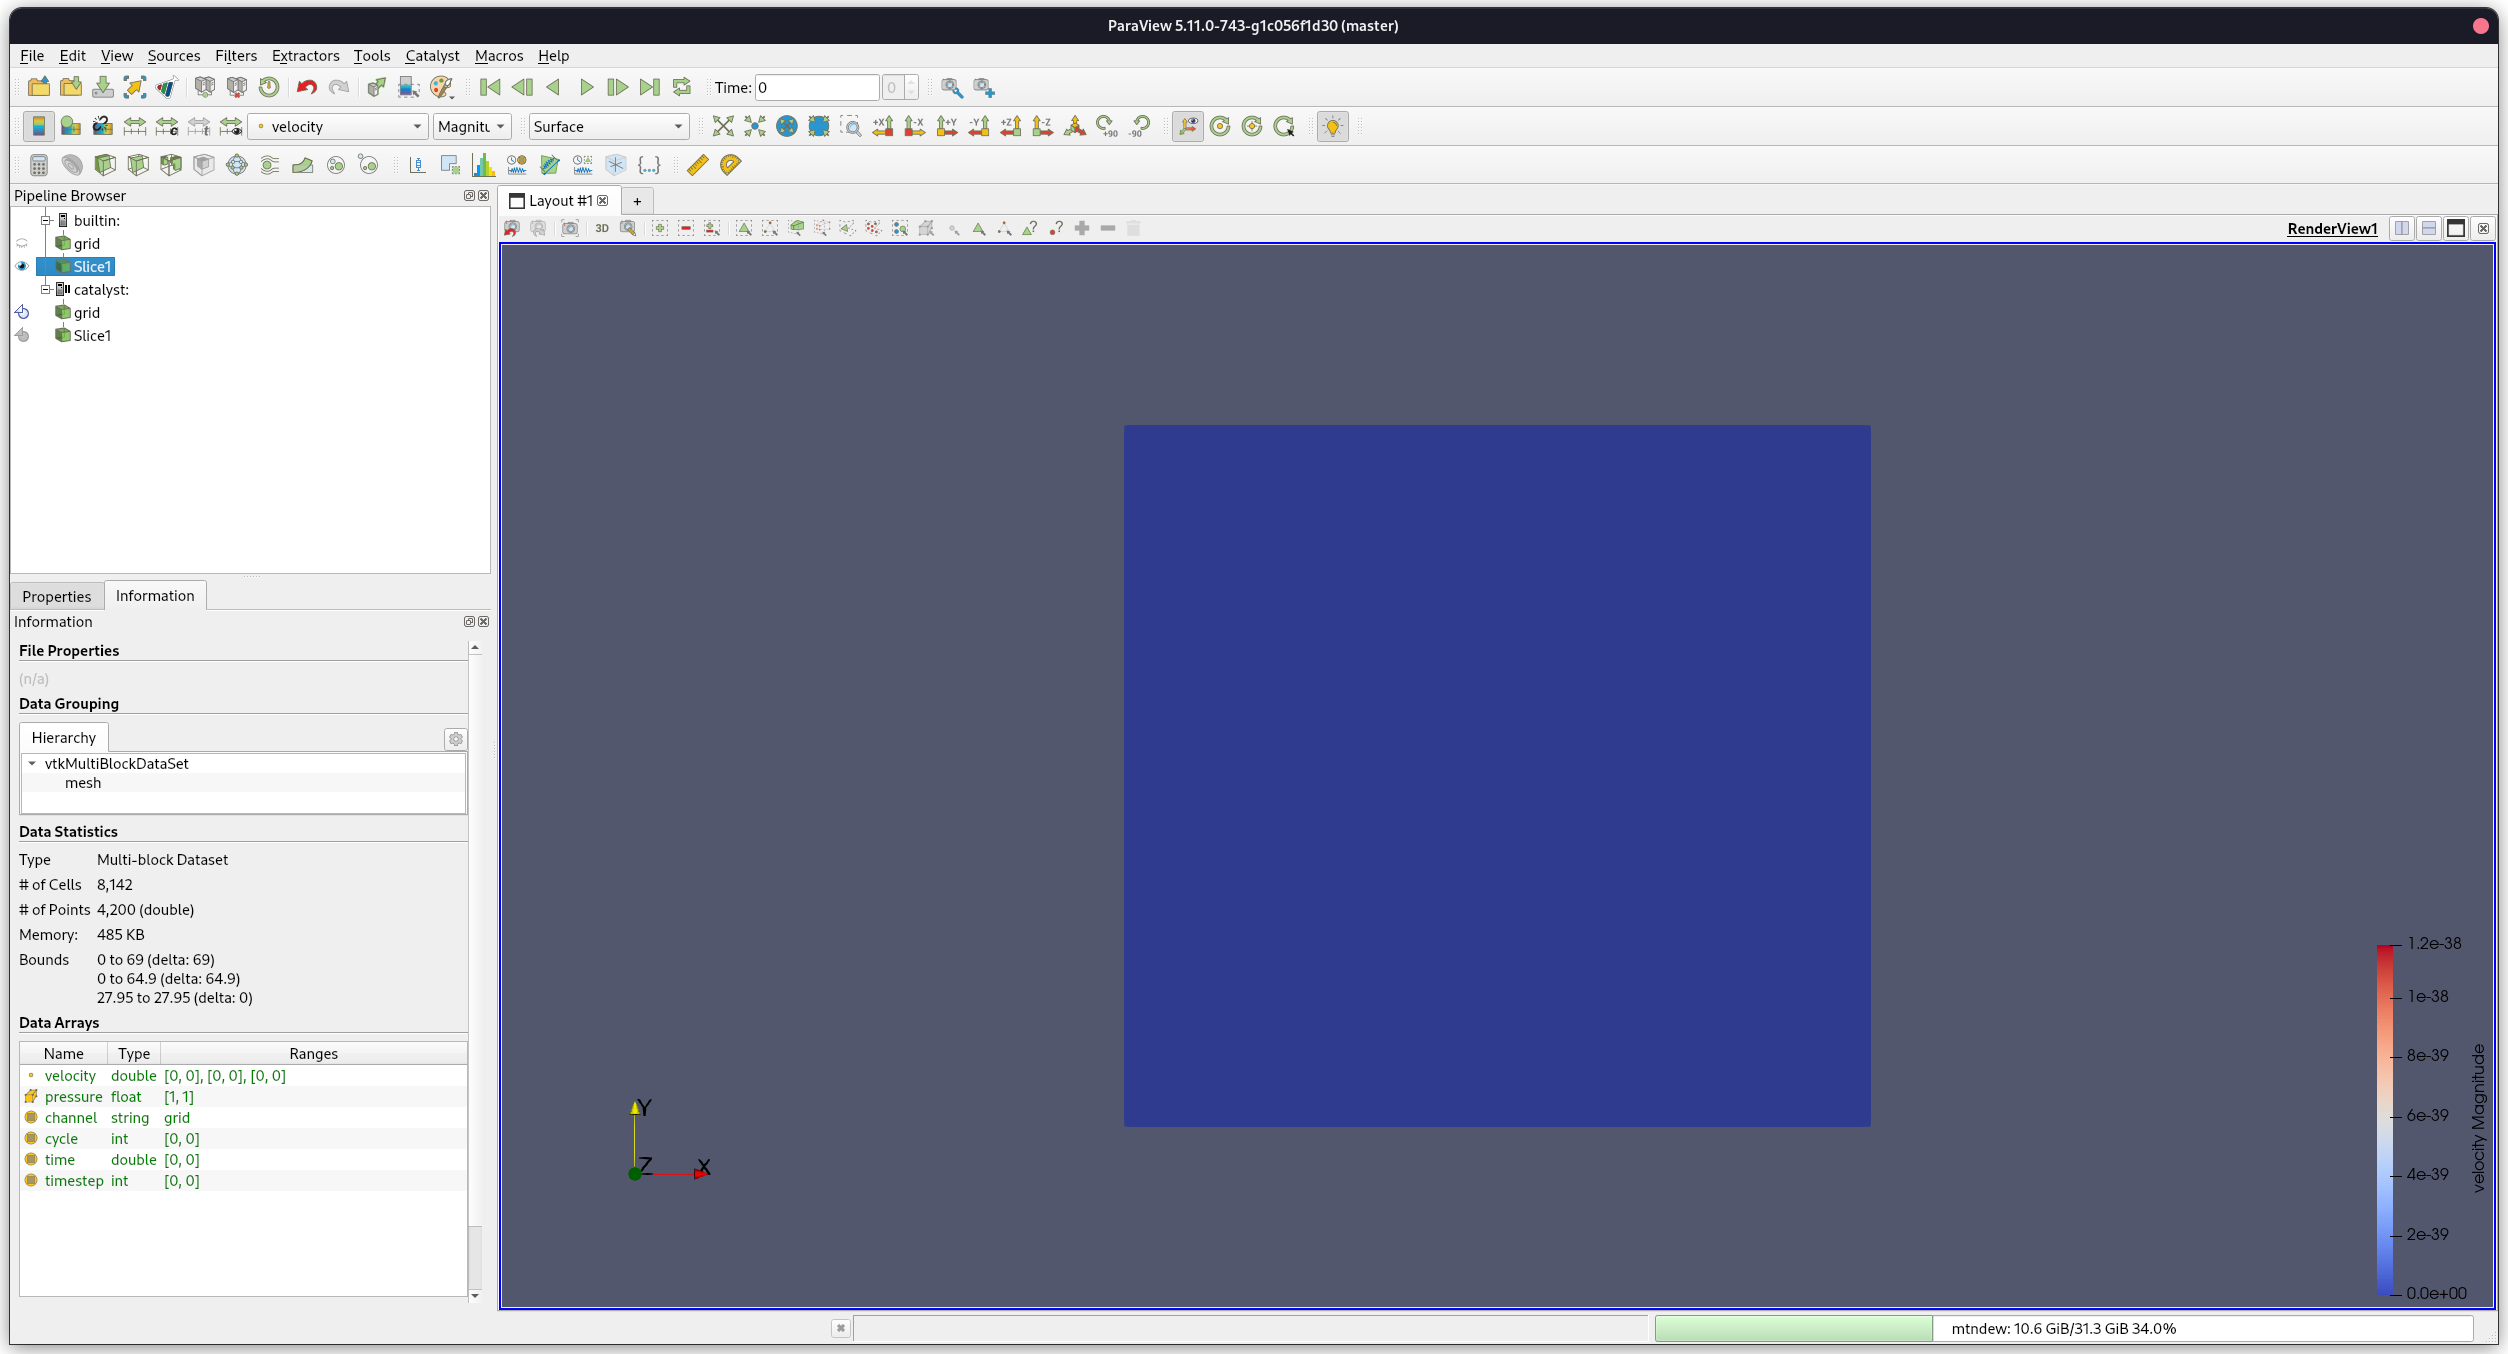
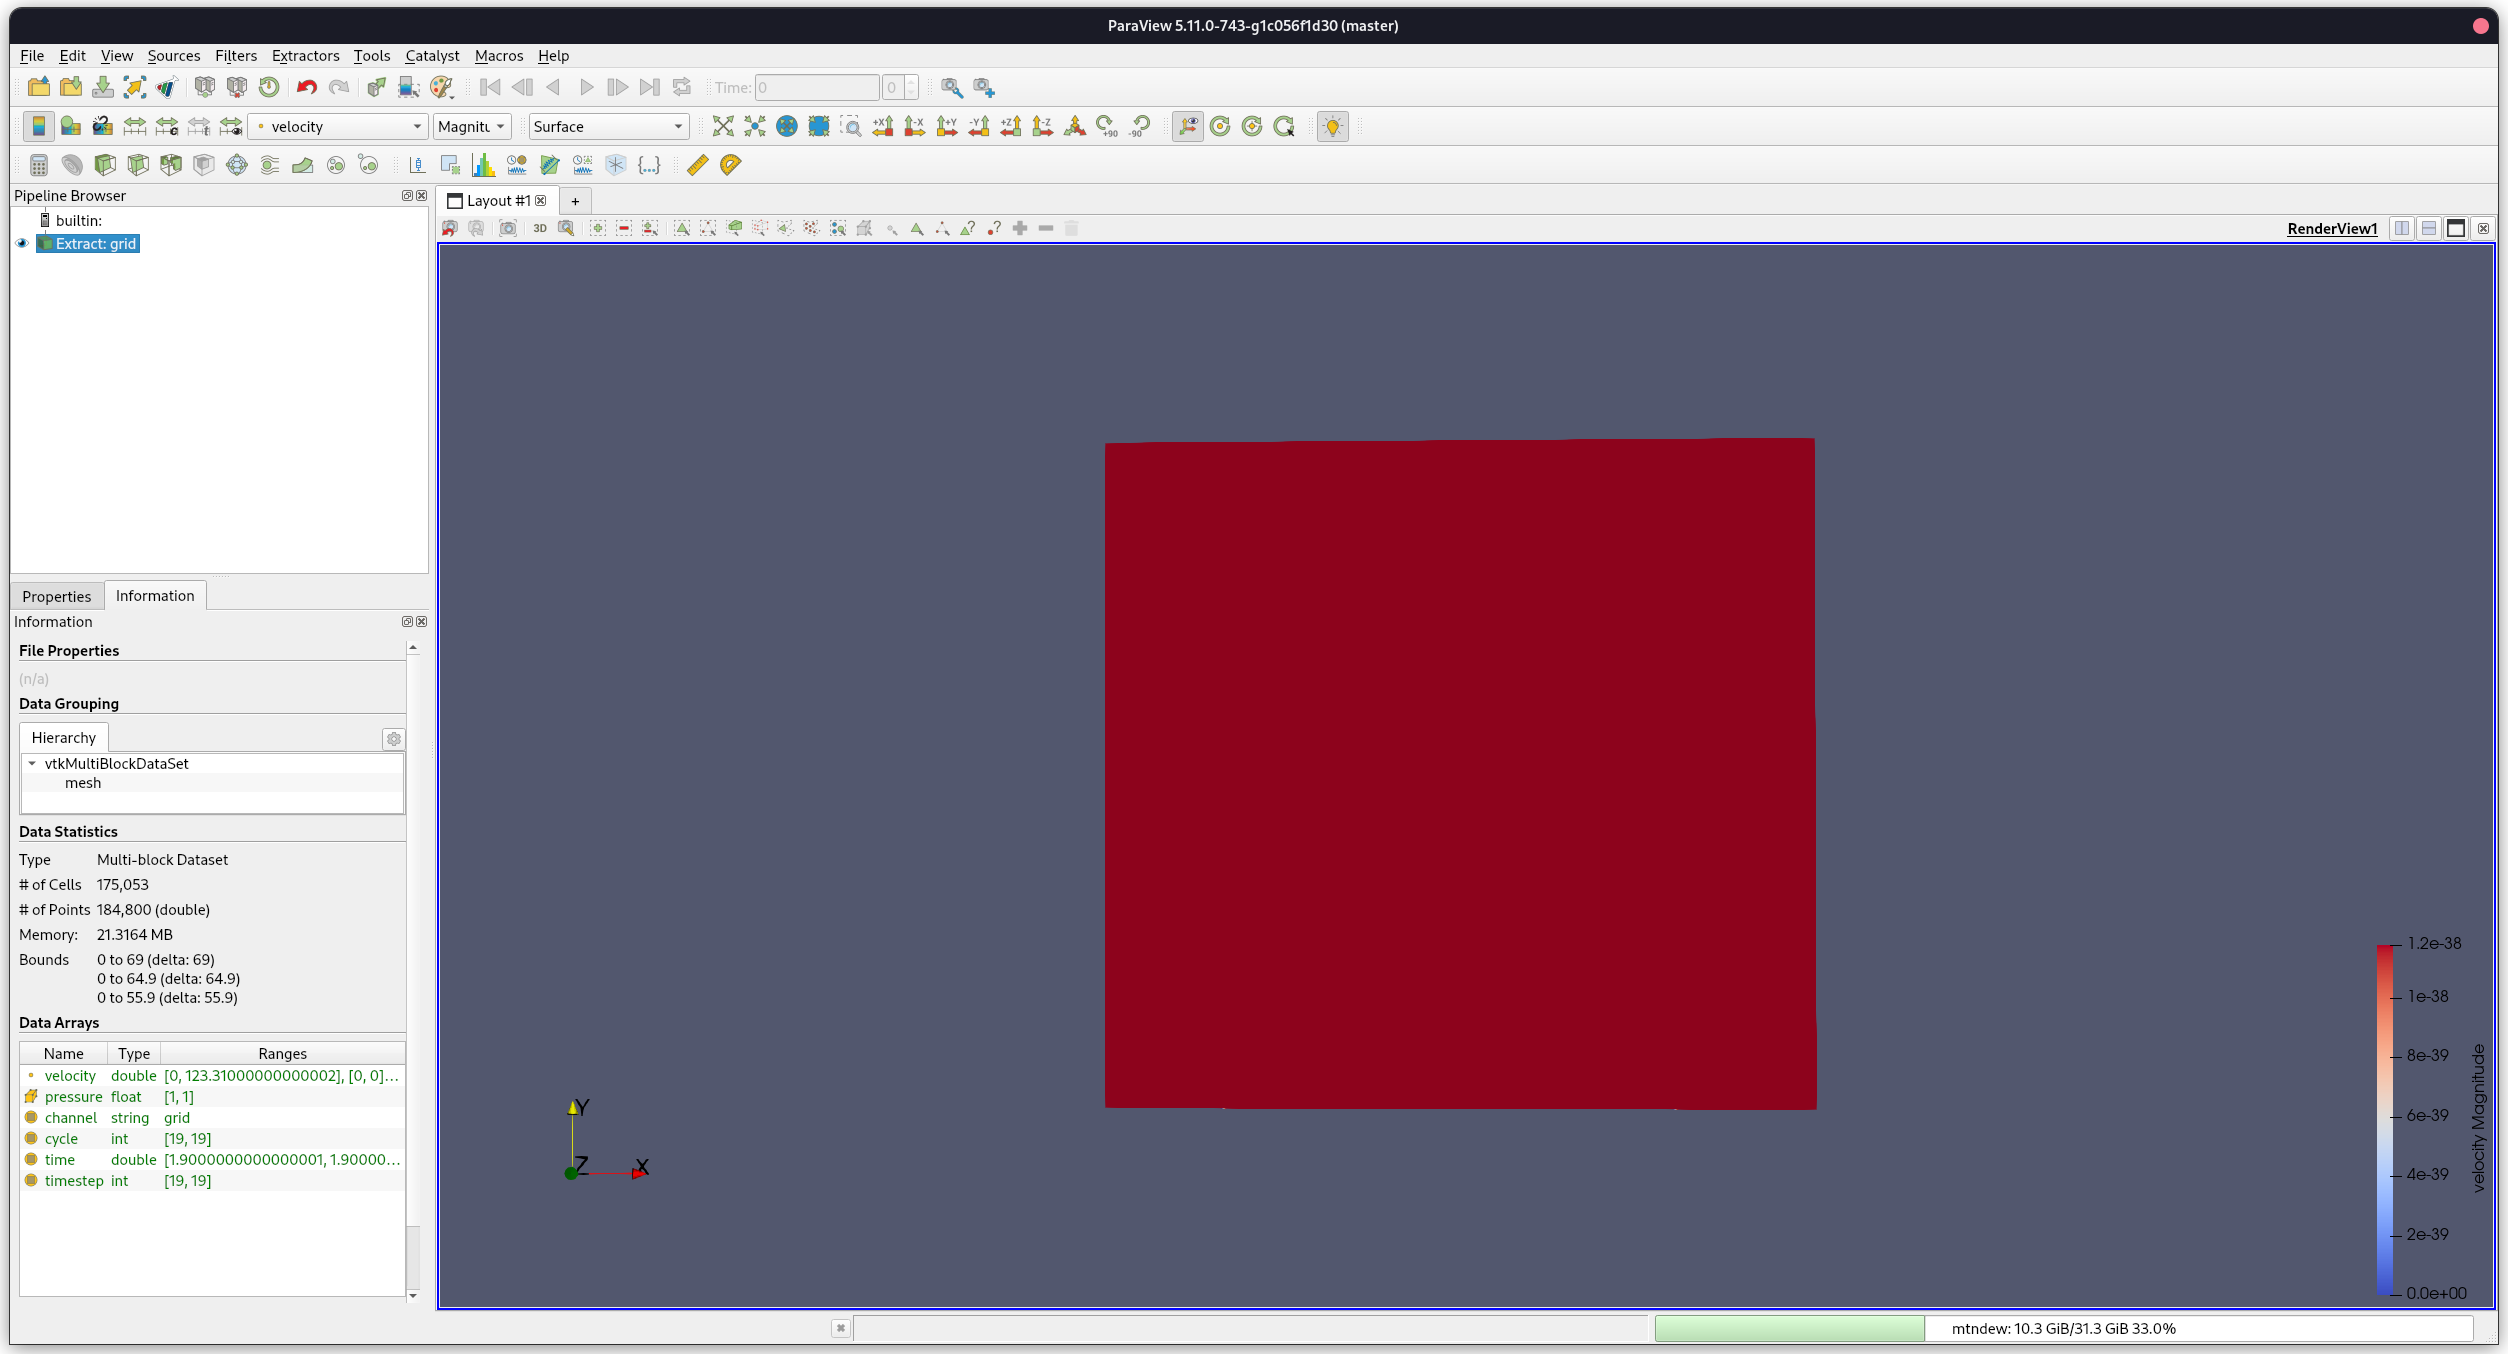
To continue, I just extract the grid and choose to see the velocity contour:

Here is where the problems start

When I go to Catalyst/Continue, the ParaView window just freezes until the end of the simulation.
I cannot do or change anything:

  • The solution does not update as the example iterates
  • I am not able to change the view in any way, the window is frozen
  • In addition, Catalyst/Set Breakpoint does not seem to do anything, no matter what I set as a breakpoint the simulation iterates until the end and then stops

When I click “OK”, the view updates to the final values and Catalyst closes:

Is there anything I am missing here?
The Catalyst legacy examples work just fine.
Is there anything else I need to do for Catalyst2?

@Lucas_Givord @Francois_Mazen @nicolas.vuaille

Hello @SadBoySquad,

I quickly tested the same example with Catalyt2 and I have exactly like you.

Regarding the freeze issue, it would seem that it is due to the fact that the simulation is faster than the visualization pipeline, by consequent paraview has still not finished treating the step 1 that it already receives data for step2 and so on until the end of the simulation. To confirm that, I simply add a time.sleep(1) in the catalyst_execute in the catalyst_pipeline.py and I can have an interactive pipeline.

For the breakpoint issue, if you’re interested I opened last month an issue about it https://gitlab.kitware.com/paraview/paraview/-/issues/21735 :slight_smile:

@Lucas_Givord

So, it seems that that breakpoint thing is indeed a bug…

Regarding the addition of time.sleep(1), where exactly do you add it?
Are you utilizing the original catalyst_pipeline.py that is present in the repository, or are you using the modified catalyst2_pipeline.py mentioned in the guide written by @nicolas.vuaille?

On one hand, catalyst2_pipeline.py does not contain any definitions for catalyst_execute. So I assume you are using the original catalyst_pipeline.py.

However, if I add time.sleep(1) inside the definition, I get the following error:

module.catalyst_execute(info)
File “/home/sadboysquad/lib/paraview/Examples/Catalyst2/CxxFullExample/catalyst_pipeline.py”, line 18, in catalyst_execute
time.sleep(1)
NameError: name ‘time’ is not defined

Perhaps you are also importing something additional?

Yes I use the original pipeline and I also added import time to be able to call sleep

@Lucas_Givord

Thank you for the quick fix!
It indeed does work!

I guess you are right, the influx of data from the example code is too much for ParaView to be able to handle and render before receiving new data.

I have a couple more questions regarding Catalyst2.

When I run the Catalyst2 enabled example and go to ParaView, the grid filter in the pipeline has the correct attributes (Cells, Points, etc):

If I try to create a Slice inside the catalyst pipeline, the slice is not created.


As you can see, it has zero Cells/Points etc.
I have to extract the grid and then create the slice:

However, when running Catalyst Legacy examples I am able to add slices, calculators etc inside the catalyst pipeline, without needing to extract the grid first.

Moreover, how would I go about adding a slice, or any other filter for that matter, in catalyst_pipeline.py?
If I add:

Slice1 = Slice( guiName=“Slice1”, Crinkleslice=0, SliceOffsetValues=[0.0], Triangulatetheslice=1, SliceType=“Plane” )
Slice1.SliceType.Offset = 0.0
Slice1.SliceType.Origin = [34.5, 32.45, 27.95]
Slice1.SliceType.Normal = [1.0, 0.0, 0.0]

The catalyst pipeline contains a slice filter, but it is again empty.

Is there a way to alter the state via the python script, or do I need to have dummy data to create a new state from scratch?